Chromatin regulators (CR) regulate local or global epigenetic patterns which play a critical role in affect multiple target expression. Given the development of high-throughput technologies, chromatin immunoprecipitation sequencing (ChIP-seq) has become an important strategy for identifying the target genes and functions of CRs. More importantly, integrating annotations and analysis will be very useful for elucidating the regulatory mechanisms of CRs.
Here, we established the CRdb database (http://cr.liclab.net/crdb), which aimed to record massive available resources for CRs and provide substantial annotations and analysis functions of CRs.

The current version of CRdb collected a total of 647 CRs and over 2,500 CRs associated ChIP-seq data from more than 300 human tissues and cell types. CRdb provides a conveniently user-friendly interface to query, browse, analyze and download CRs and their related annotation information.
CRdb provides eight annotation sections including CR overview, CR-associated genes network, details of CR based on ChIP-seq, downstream target genes, upstream regulatory details, annotation, survival, expression and disease information. The genetic and epigenomic data involved super-enhancers, enhancers, transcription factor binding sites(TFBS), methylation sites, common single nucleotide polymorphisms (SNPs), risk SNPs, expression quantitative trait locus(eQTL), 3D chromatin interactions and chromatin accessibility (ATAC). In addition, CRdb provide four analysis to perform the in-depth analysis of CR: (i)CR gene set enrichment, (ii)CR binding genomic region annotation, (iii)CR-TF co-occupancy analysis, (iv)CR regulatory axis analysis.
URL: http://cr.liclab.net/crdb/search.php
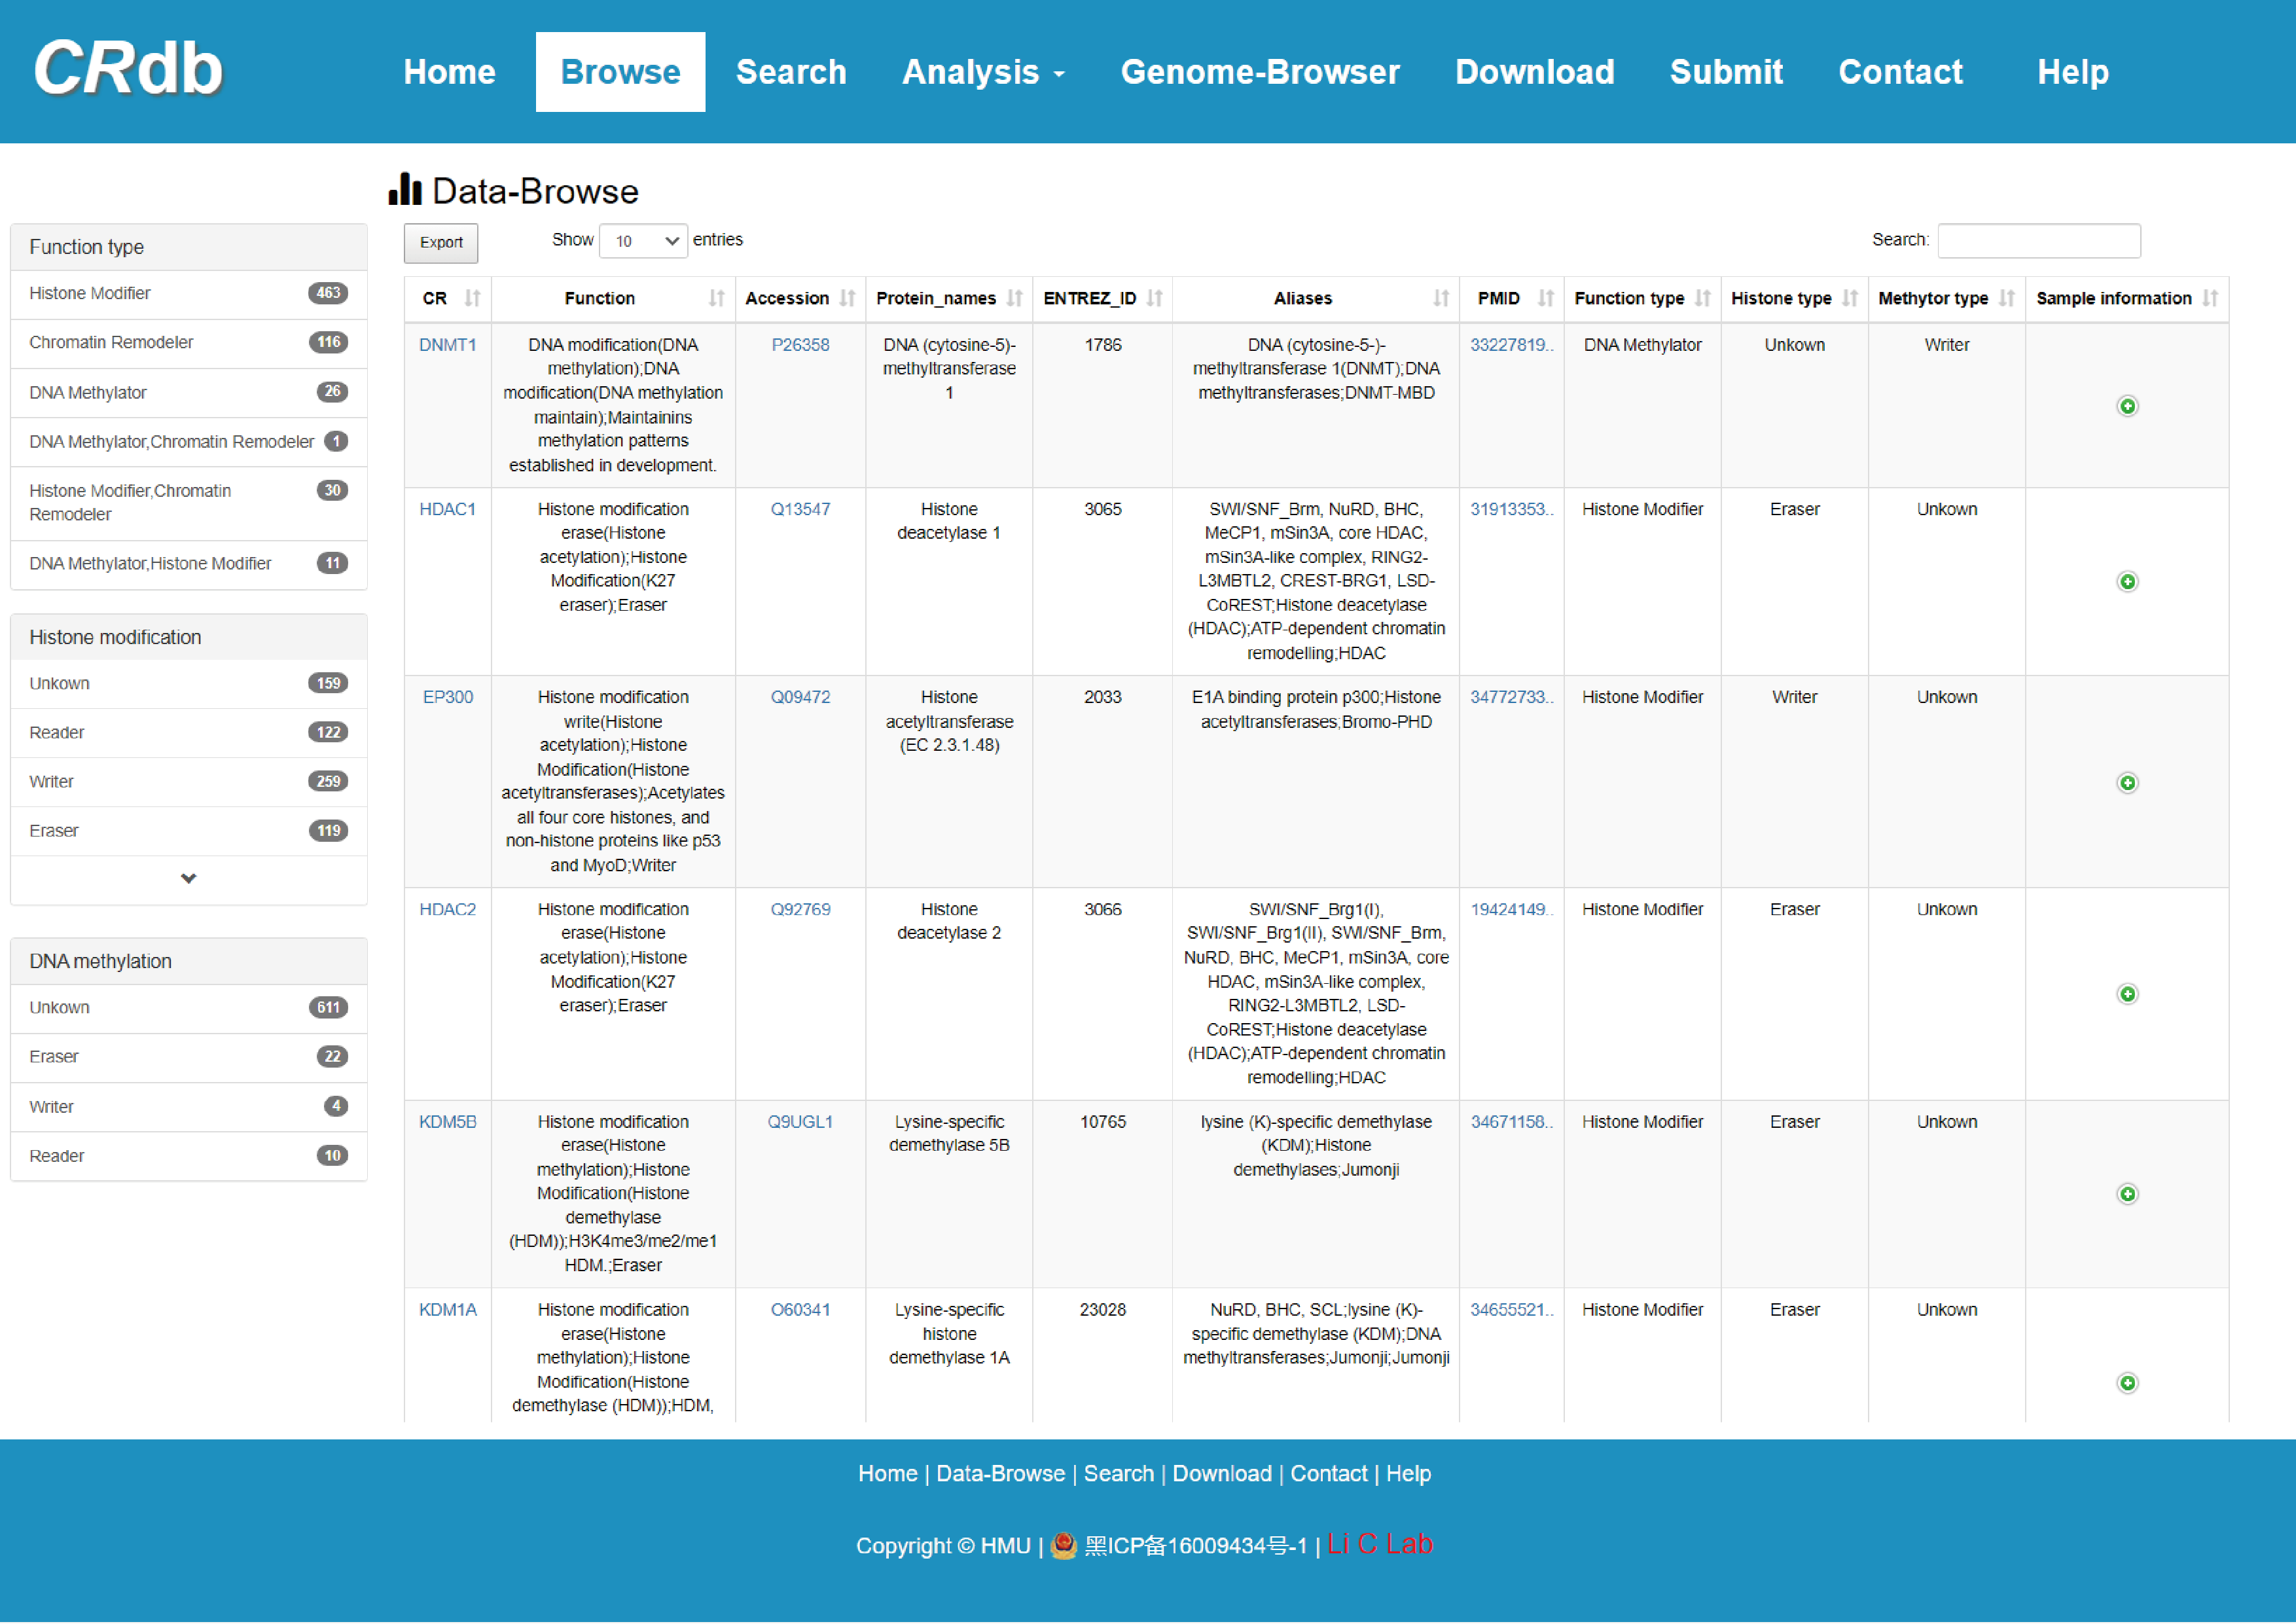
4.1 Browse
The “Data-browse” page provides quickly searching for CR via two different methods. First, users can retrieve the corresponding CR by selecting “Function Type of CR” (including histone modifier, DNA methylator, and chromatin remodeler), “Histone modification” and/or “DNA methylation” (including reader, writer, eraser and unknown) via the navigation bar on the left side of the page. Moreover, the right side of this page is an interactive table presenting the retrieval results from the alphabetical sorting function.
4.2 Search
CRdb provides five query methods for searching CR information. These include “Search by CR” (Input CR of interest), “Search by genomic region” (Input genomic regions), “Search by target gene” (Select method and Input a gene of interest), “Search by function type” (Select the function type of CR and the idiographic type) and “Search by Biosample term name” (Input biosample term name of interest).

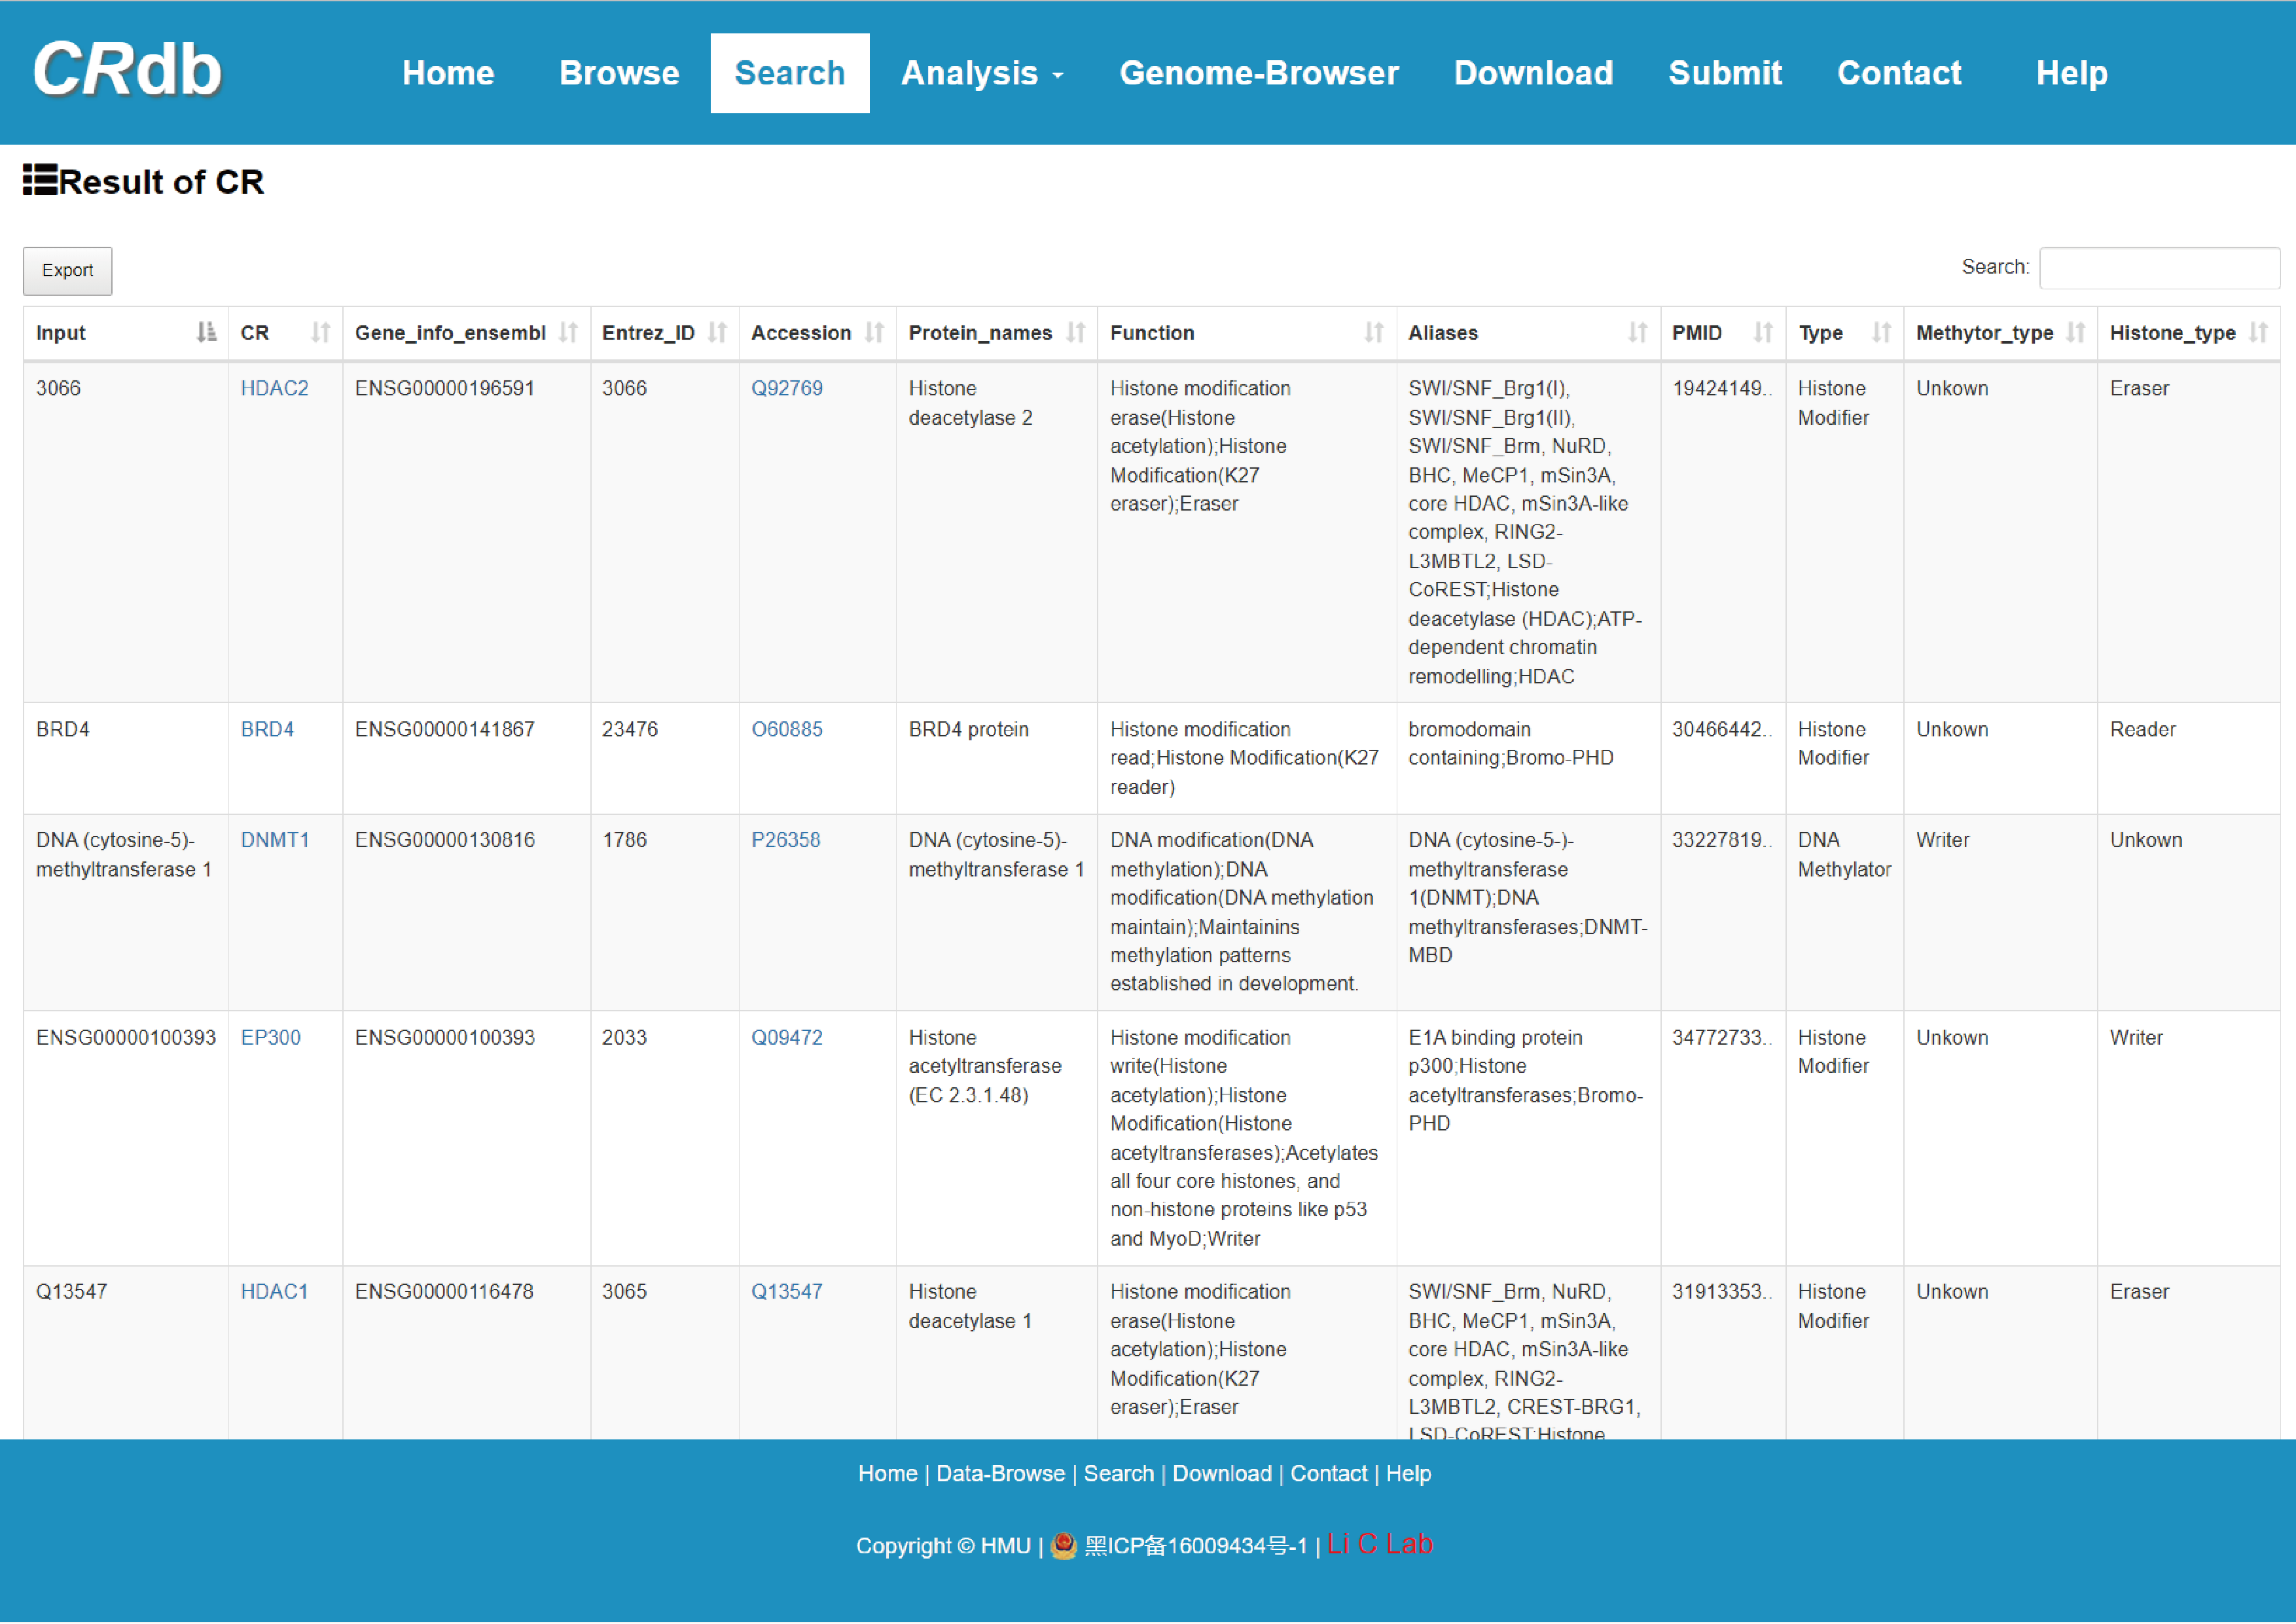
4.2.1 Search result of CR
Users input a list of CR and CRdb will display CR-related information.
The guidance for input format:
1) CR name: Users submit the gene name to query CR, including gene symbol, ENTREZ ID, Alias and Uniprot accession.
2) Result: CRdb will provide a prompt when none of the names entered by the user are CR.
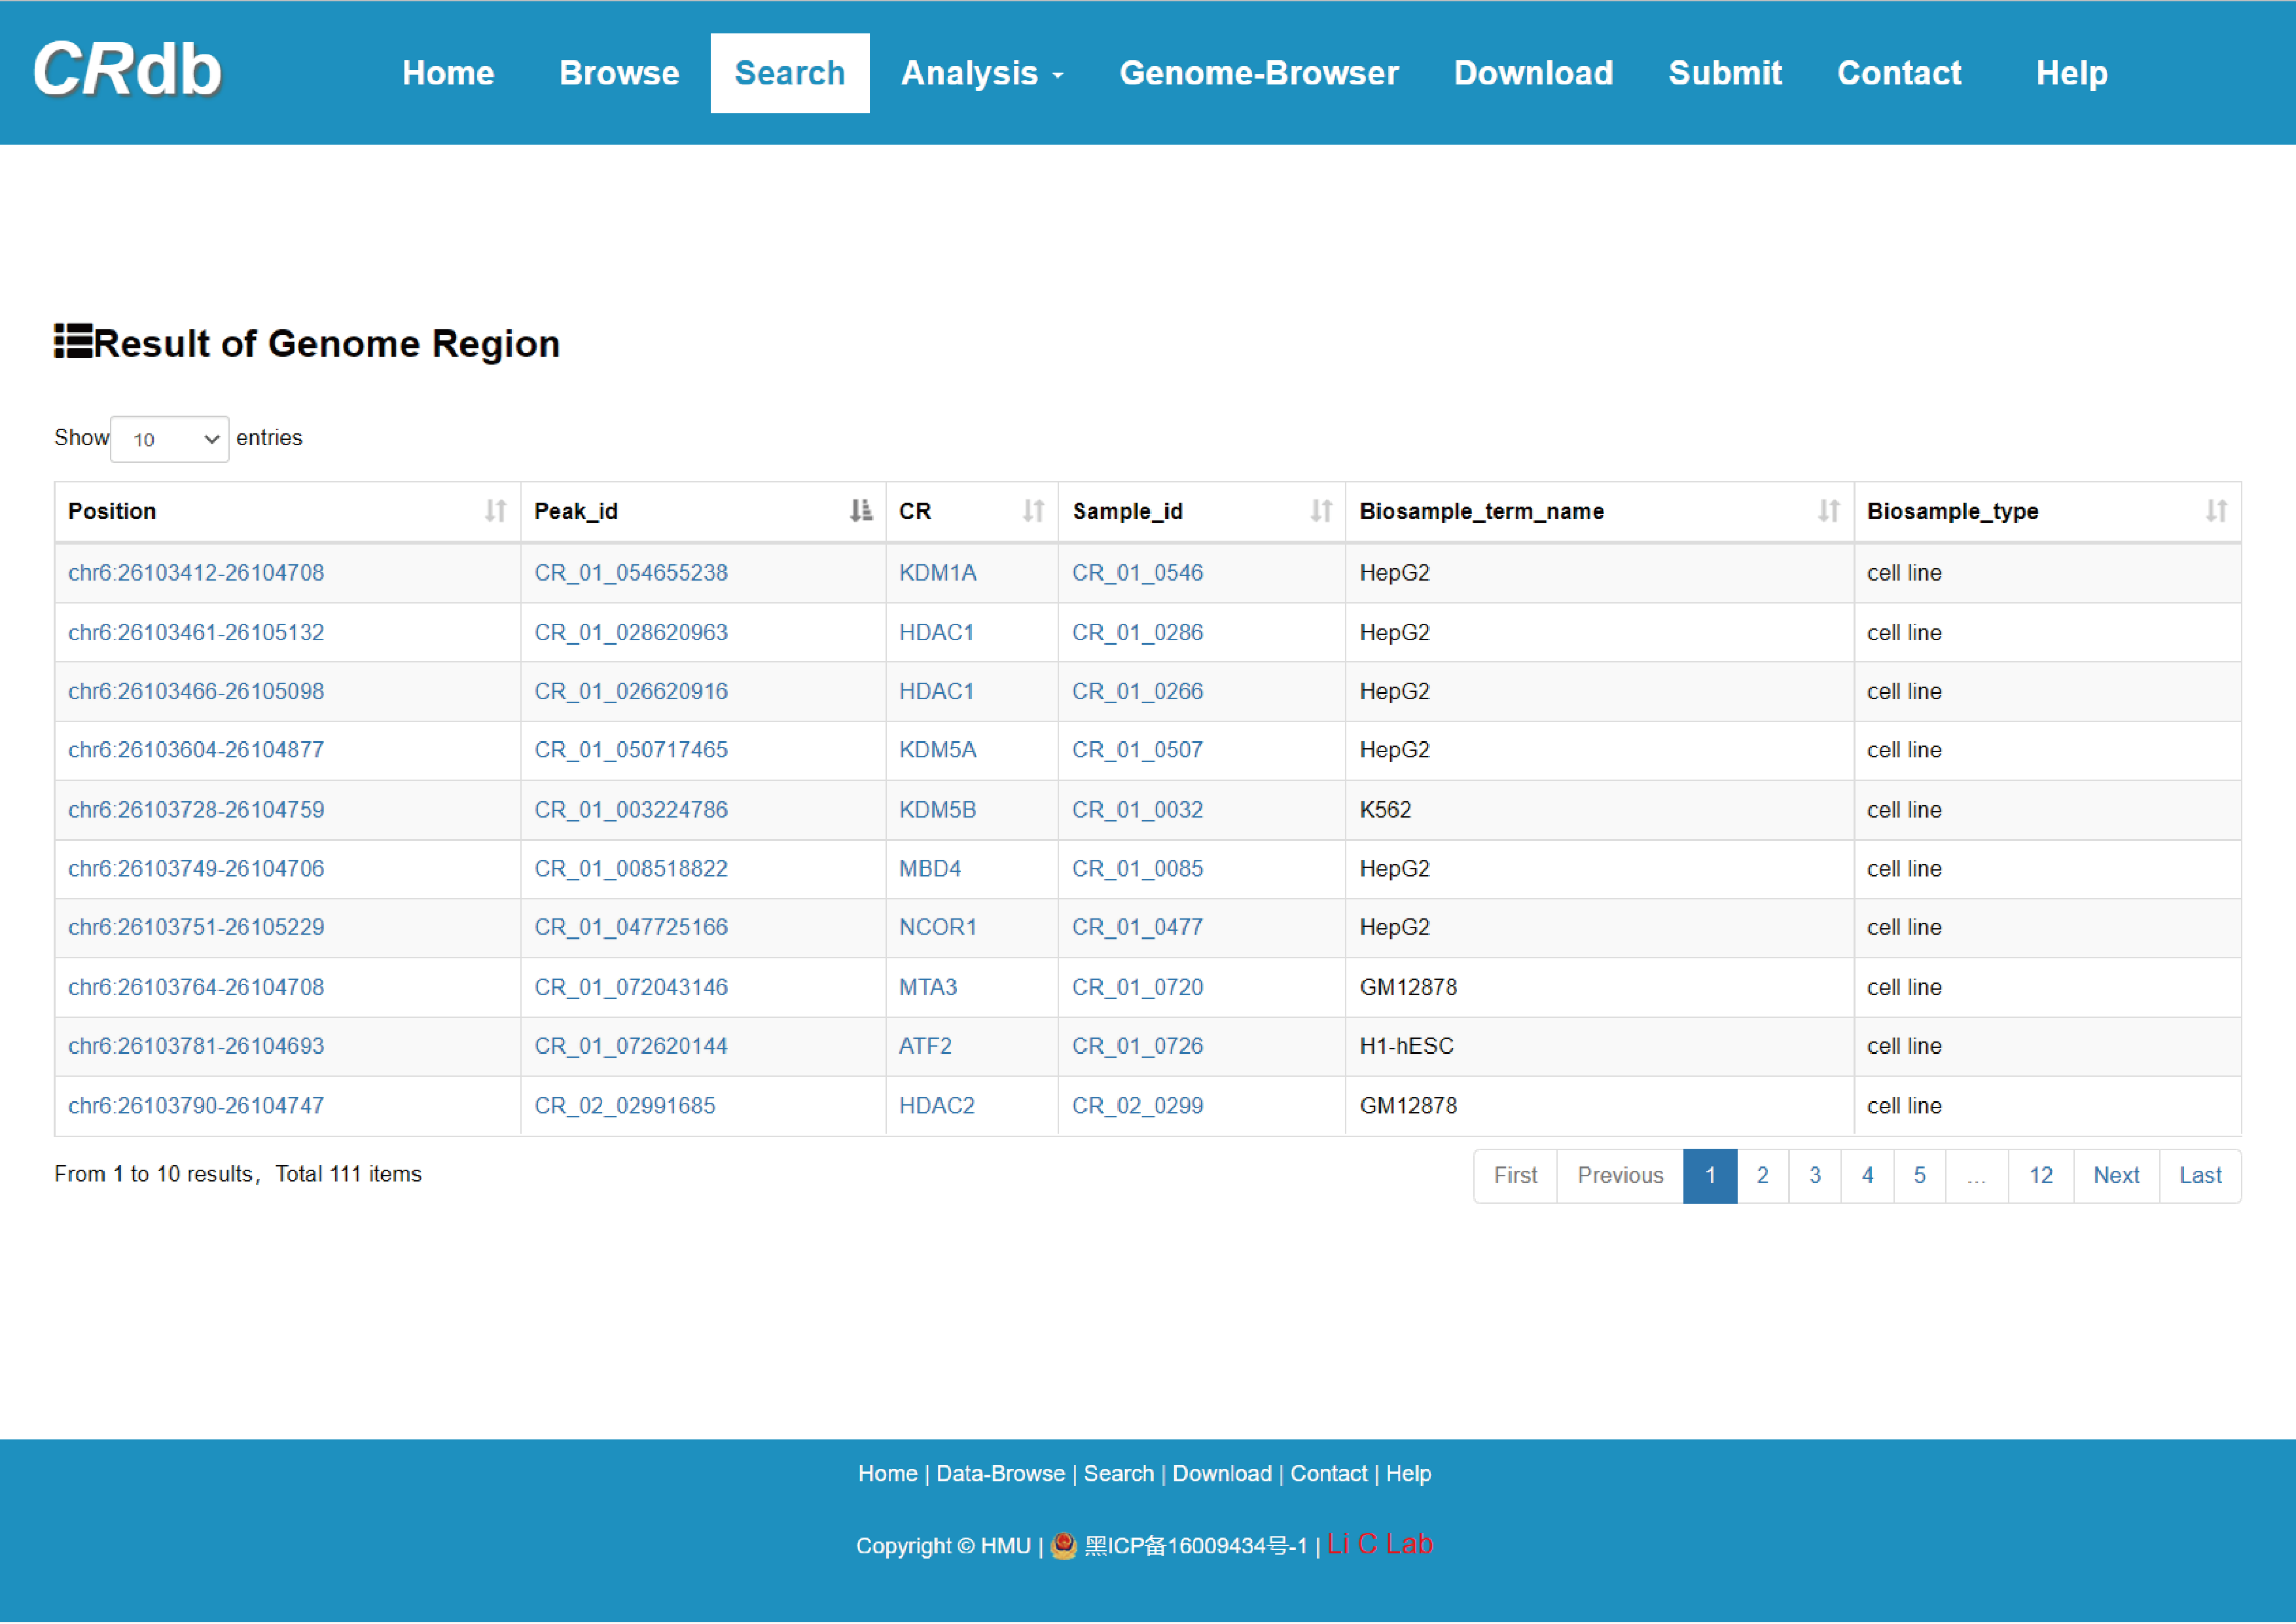
4.2.2 Search by genome region
Users input a genomic position and CRdb will identify CR regions overlapping with the submitted region.
The guidance for input format:
1) Chromosome position: Chromosome—Start position—End position.
2) Start position: The starting location of the genomic regions to which CRs binds.
3) End position: The terminal position of the genomic regions to which CRs binds.
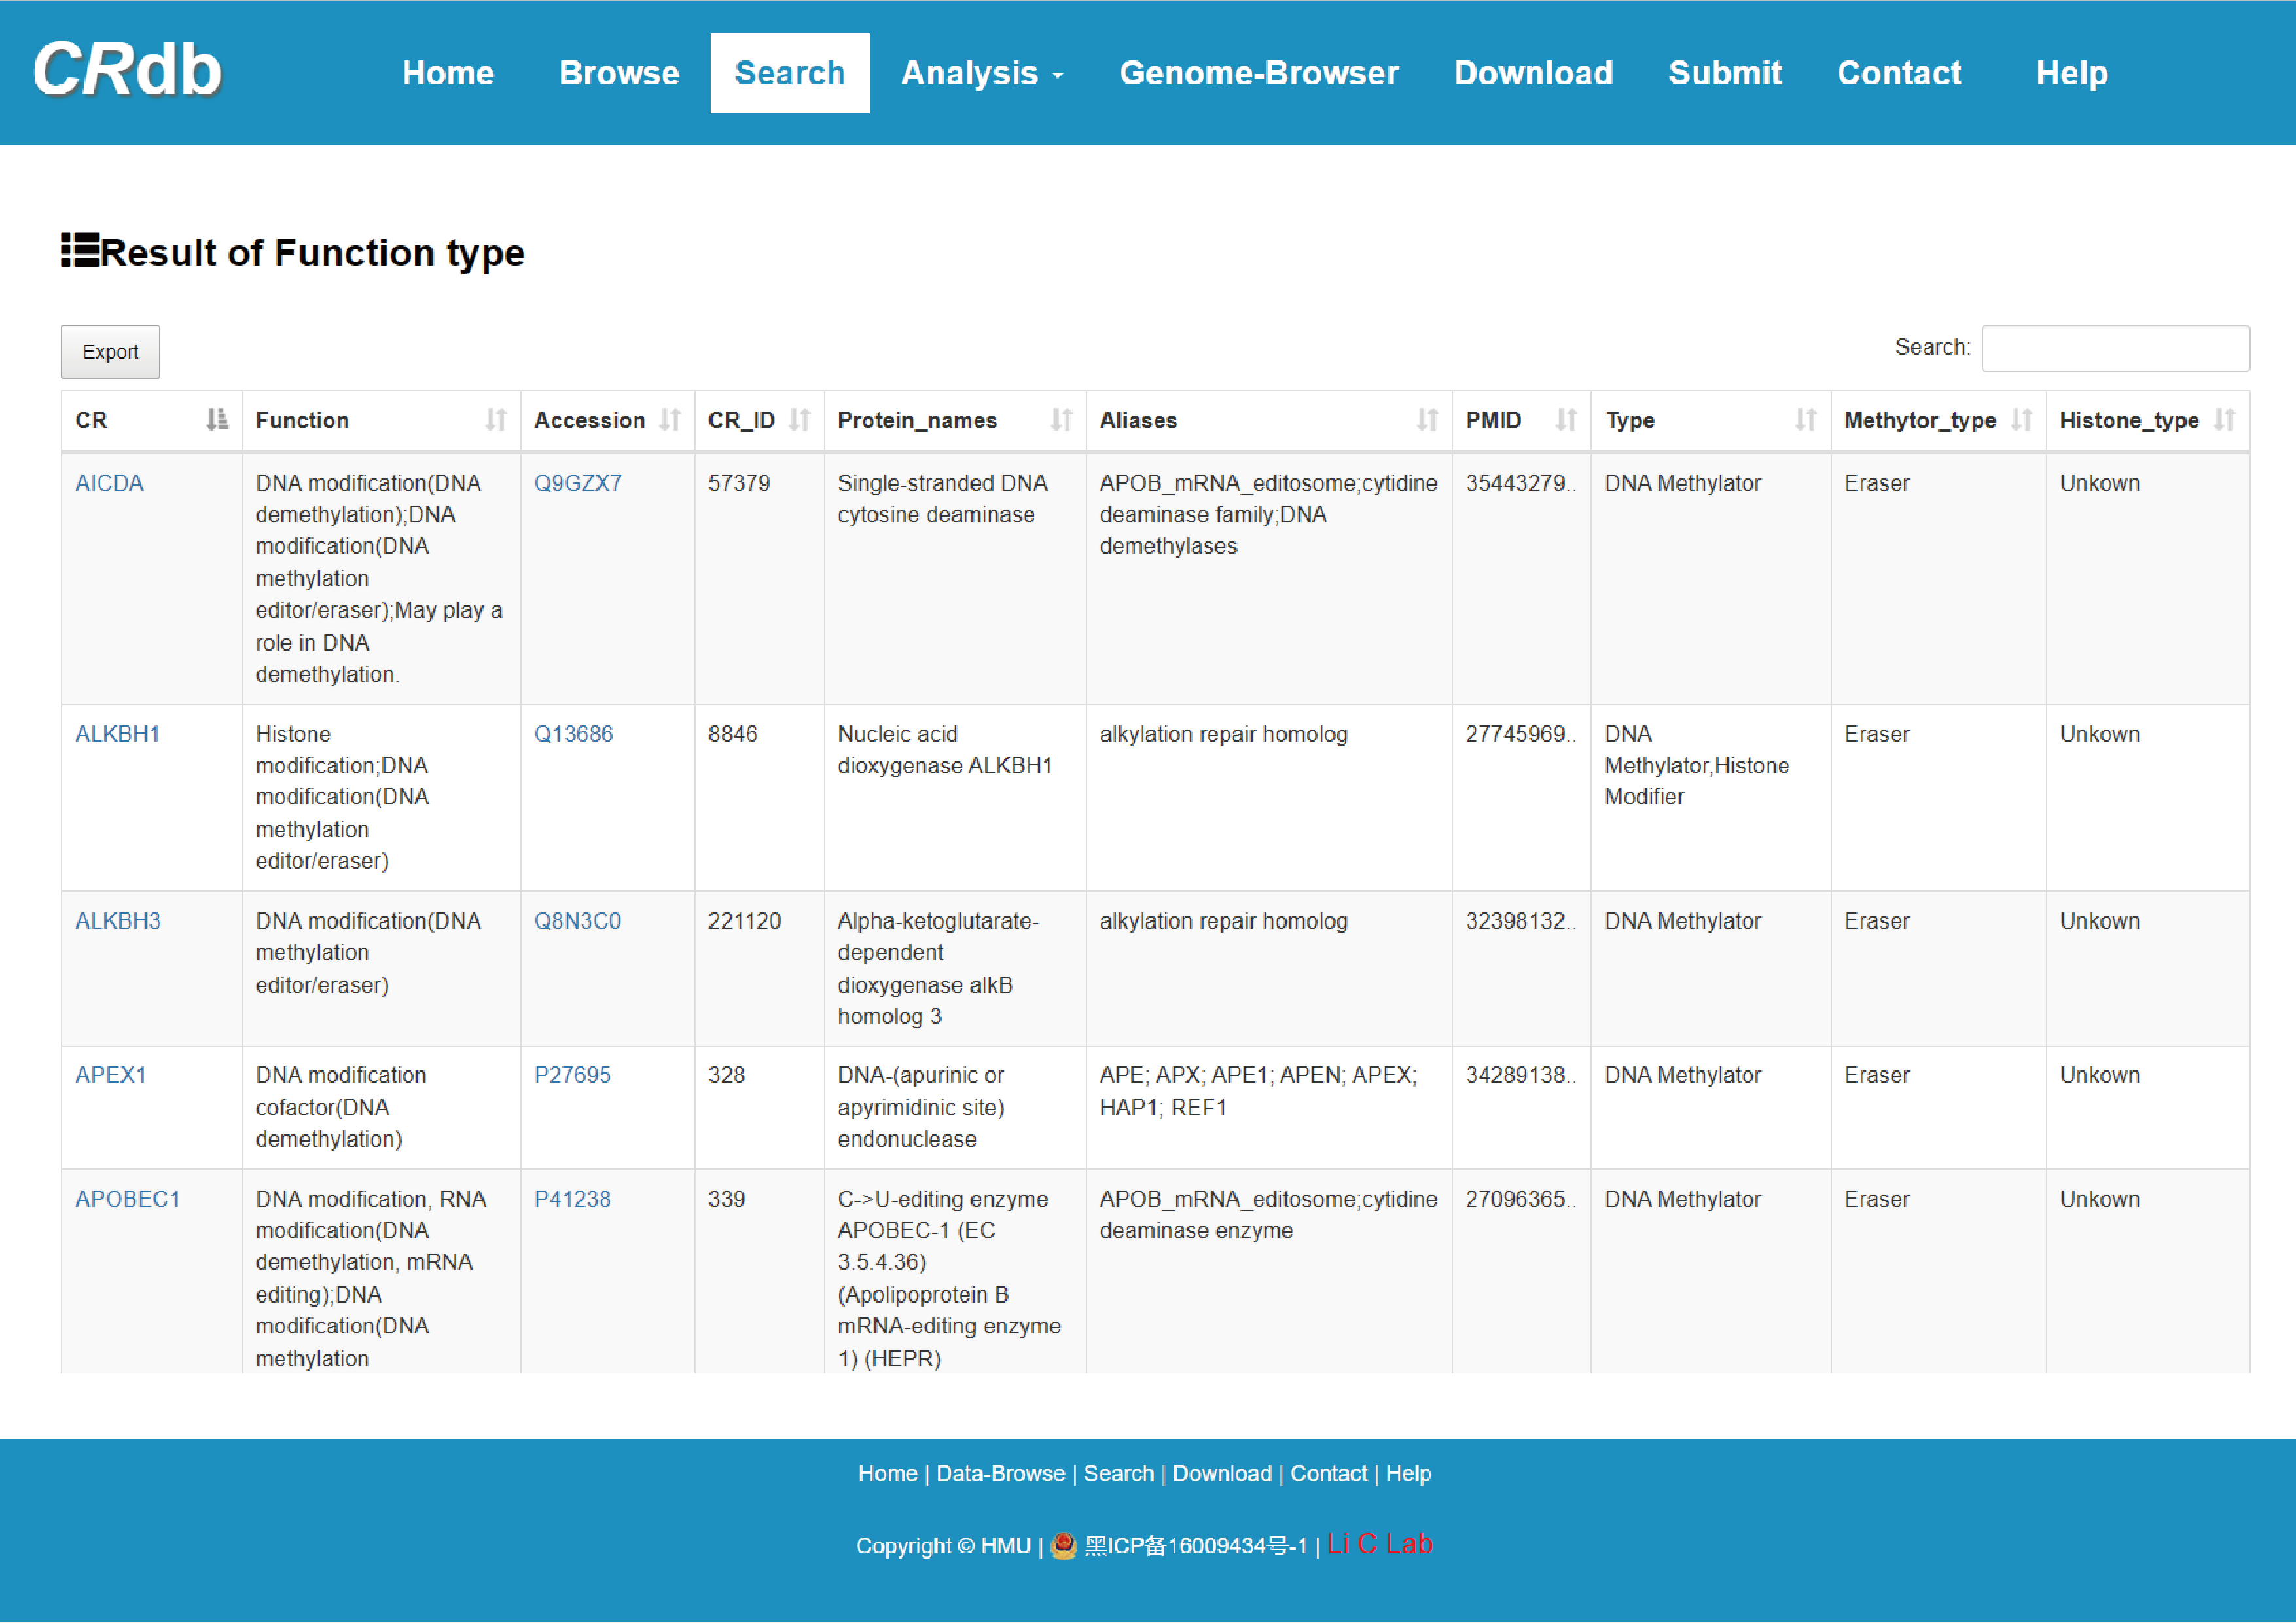
4.2.3 Search by function type
Users select the “Function type” and “Type”, CRdb will display CRs of the corresponding type.
The guidance for input format:
1) Function type: Select from the following options——Histone modifier, DNA methylator and Chromatin remodeler.
2) Type: Select from the following options——Reader, Writer, Eraser, Unknown and All.
4.2.4 Search by target gene
Users submit a gene name and CRdb will identify CRs associated with it via relationships between the CR and associated genes, which are identified under different methods.
The guidance for input format:
1) Method: Target genes are identified as follows——Rose genemapper, BETA, GEINE3, ARANCe, TRRUST and All.
Users select from the above methods; The default strategy: All.
2) Gene symbol: Users submit the genetic symbol of the target gene. Only gene symbol can be supported.
4.2.5 Search by Biosample term name
Users submit biosample term name of interest, CRdb will display the information of ChIP-seq samples about the bio-sample.
The guidance for input format:
Biosample term name: Users submit the biosample term name, such as HepG2.

4.3 CR details page
CRdb provides the basic and annotated information about each CR (including CR overview, ChIP-seq samples of CR, downstream target genes of CR, upstream regulatory details of CR and other information on CR) and the network consisting of the CR and its regulated genes
Search result of CR for DNMT1
4.4 ChIP-seq sample details page
CRdb provides a list to present the basic information about the CR ChIP-seq smaples (including Sample ID, CR name, Biosample type, File accession and Source) on the CR details page. By selecting “Sample ID”, CRdb provides the ChIP-seq overview, ChIP-seq peak annotation and the peak annotation visualization.
Users can click 'CR_02_0293' and the detail information about the region will be displayed on the next page.
4.5 Peak details page
CRdb provides elaborate information on the CR ChIP-seq area by selecting the “Peak ID”.On the peak details page, CRdb exhibits the peak overview, the annotated information (enhancers, super-enhancers, risk SNPs, common SNPs, LD SNPs, eQTLs, DHSs, ATAC, 3D chromatin interactions, WGBS, TAD and CRISPR) and the target genes of peak.
Users can click 'CR_02_029310983' and the detail information about the peak will be displayed on the next page.

4.6 Analysis
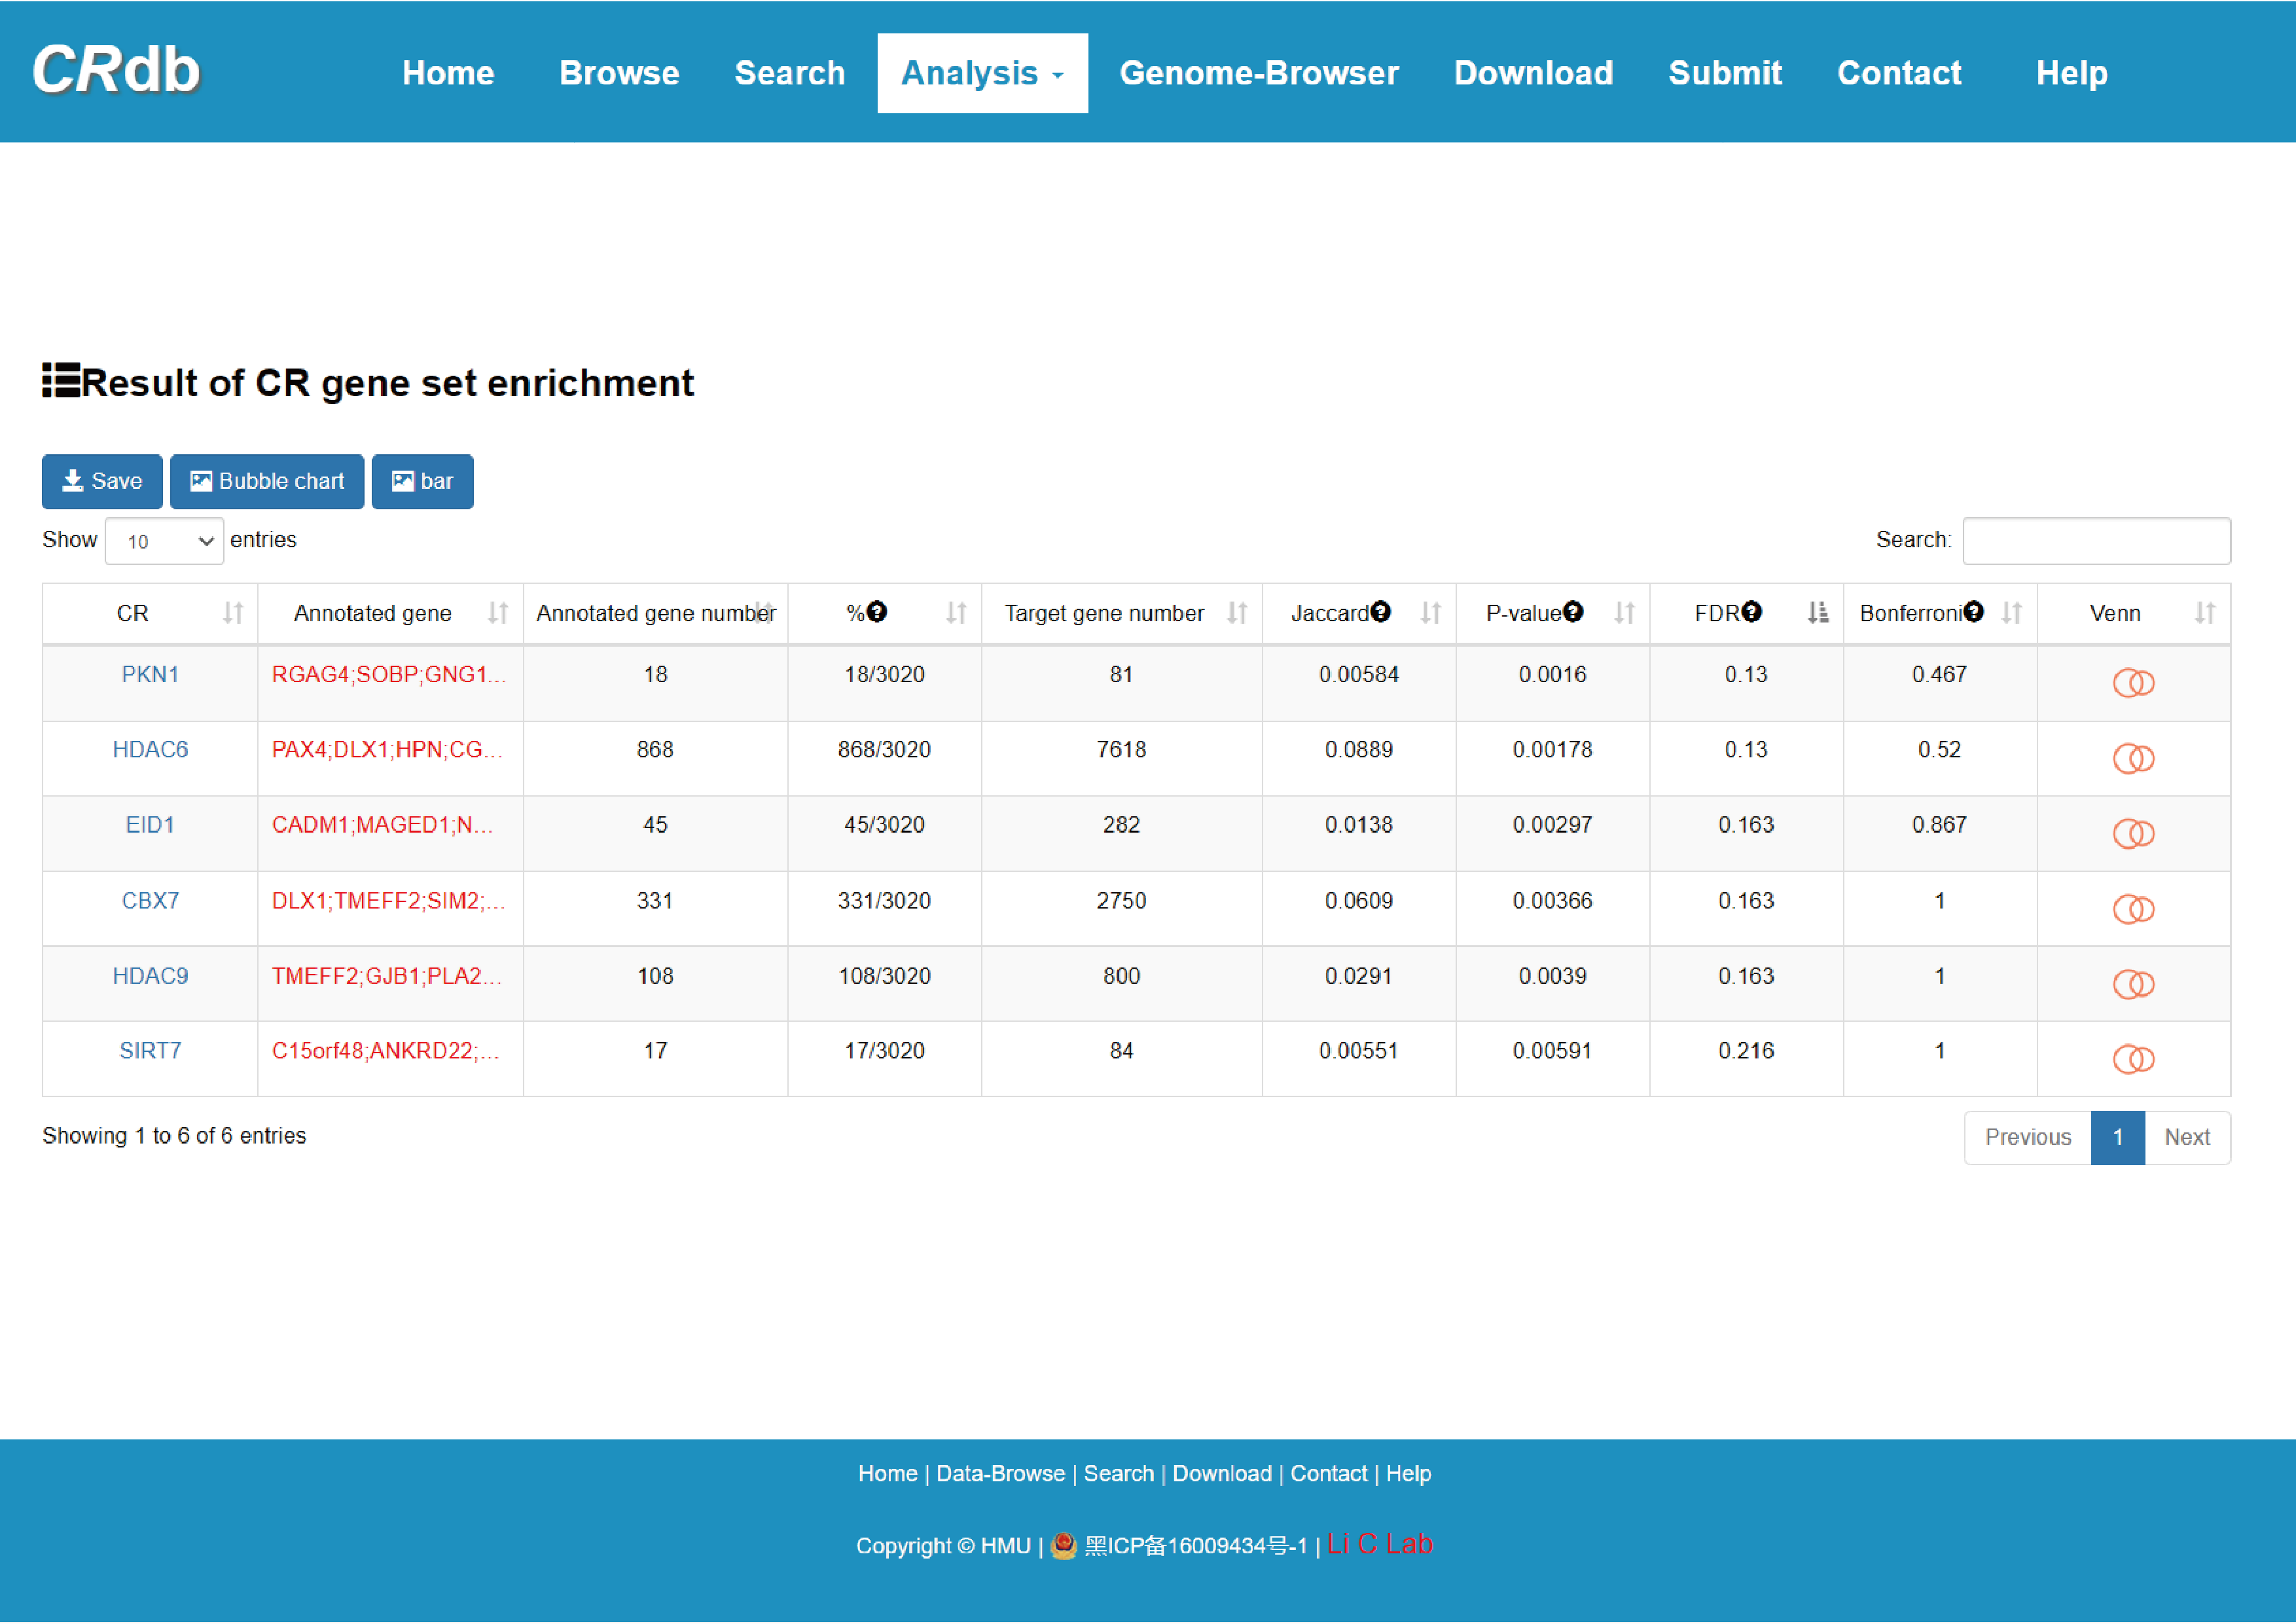
4.6.1 CR gene set enrichment analysis
Enter"CR gene set enrichment analysis "function page.
To ensure the high dependability CR-target network, we reserved the CR-target pairs that were validated by experiment or supported by more than half of the methods. With the input of gene(s) of interest or a “txt” format file. Users can submit a gene list, set p-value/FDR to perform CR gene set enrichment. CRdb will execute hypergeometric test between the submitted gene set and target gene set of each CR.
The output table shows all significant collection information related input (CR, Annotated gene, Target gene number, Annotated gene number), enrichment score P-value, FDR, Jarcard and Bonferroni. The CR can be visualized by clicking the "CR" button.
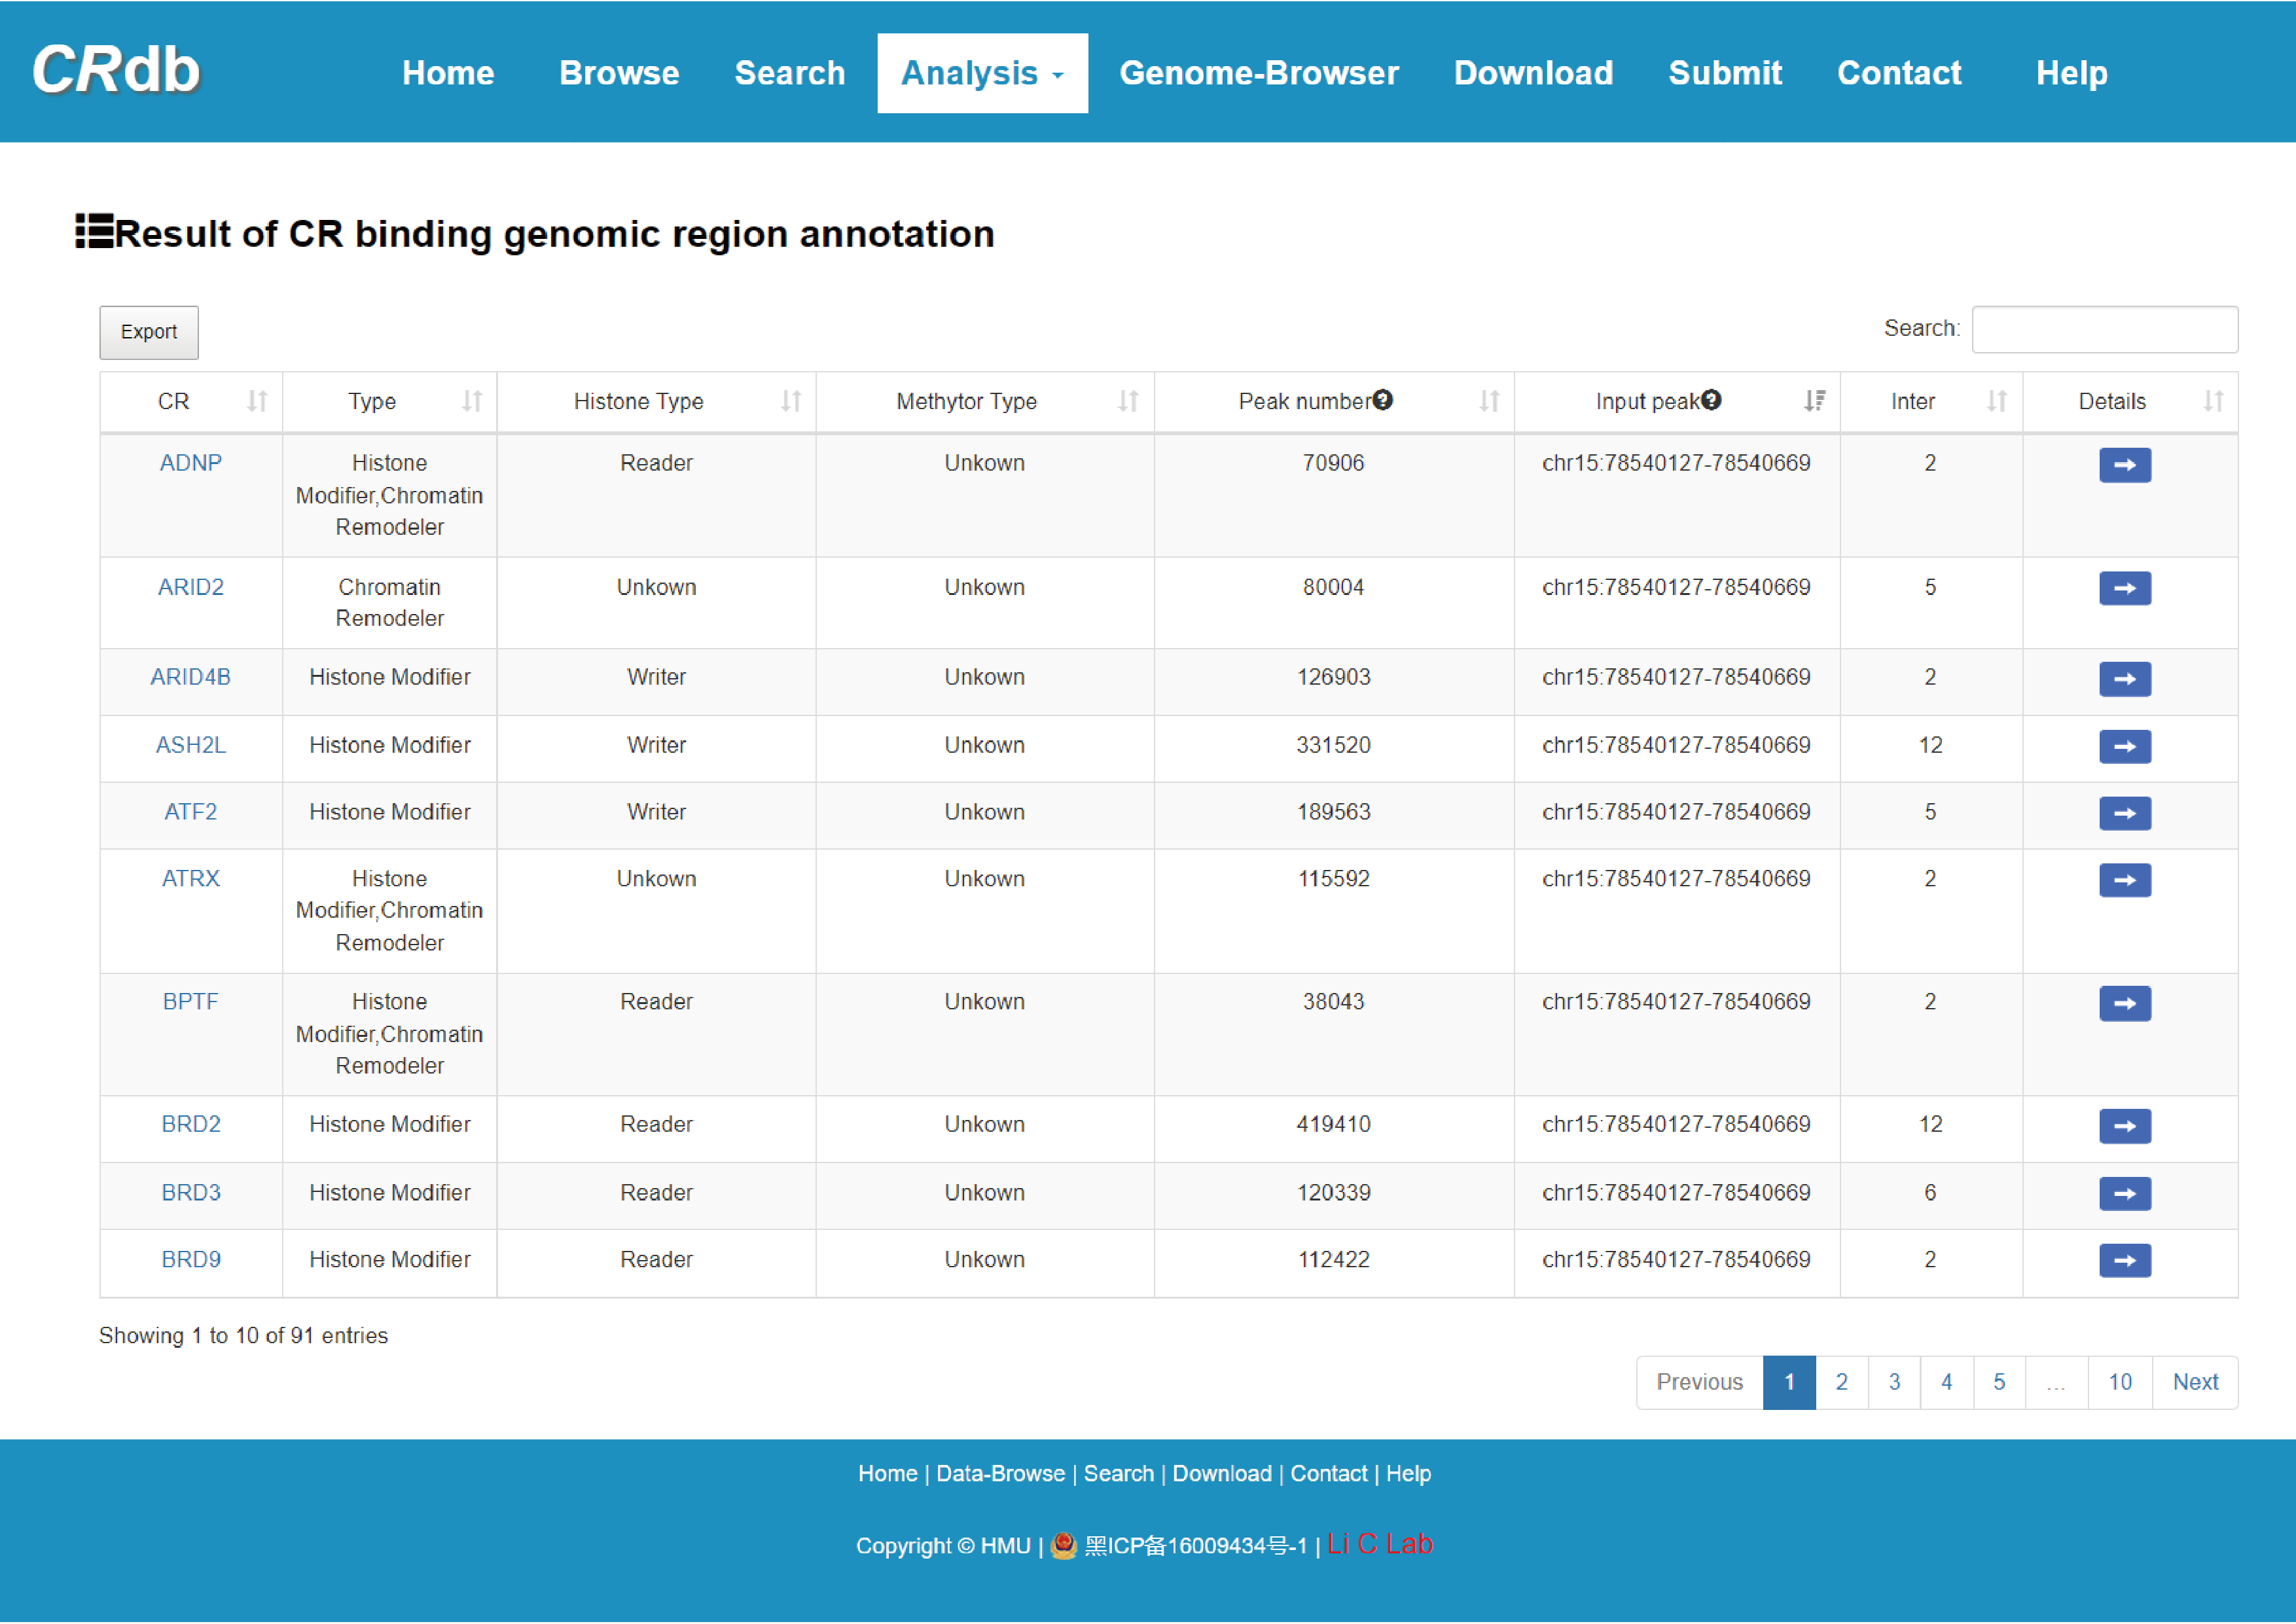
4.6.2 CR binding genomic region analysis
Enter" CR binding genomic region analysis"function page.
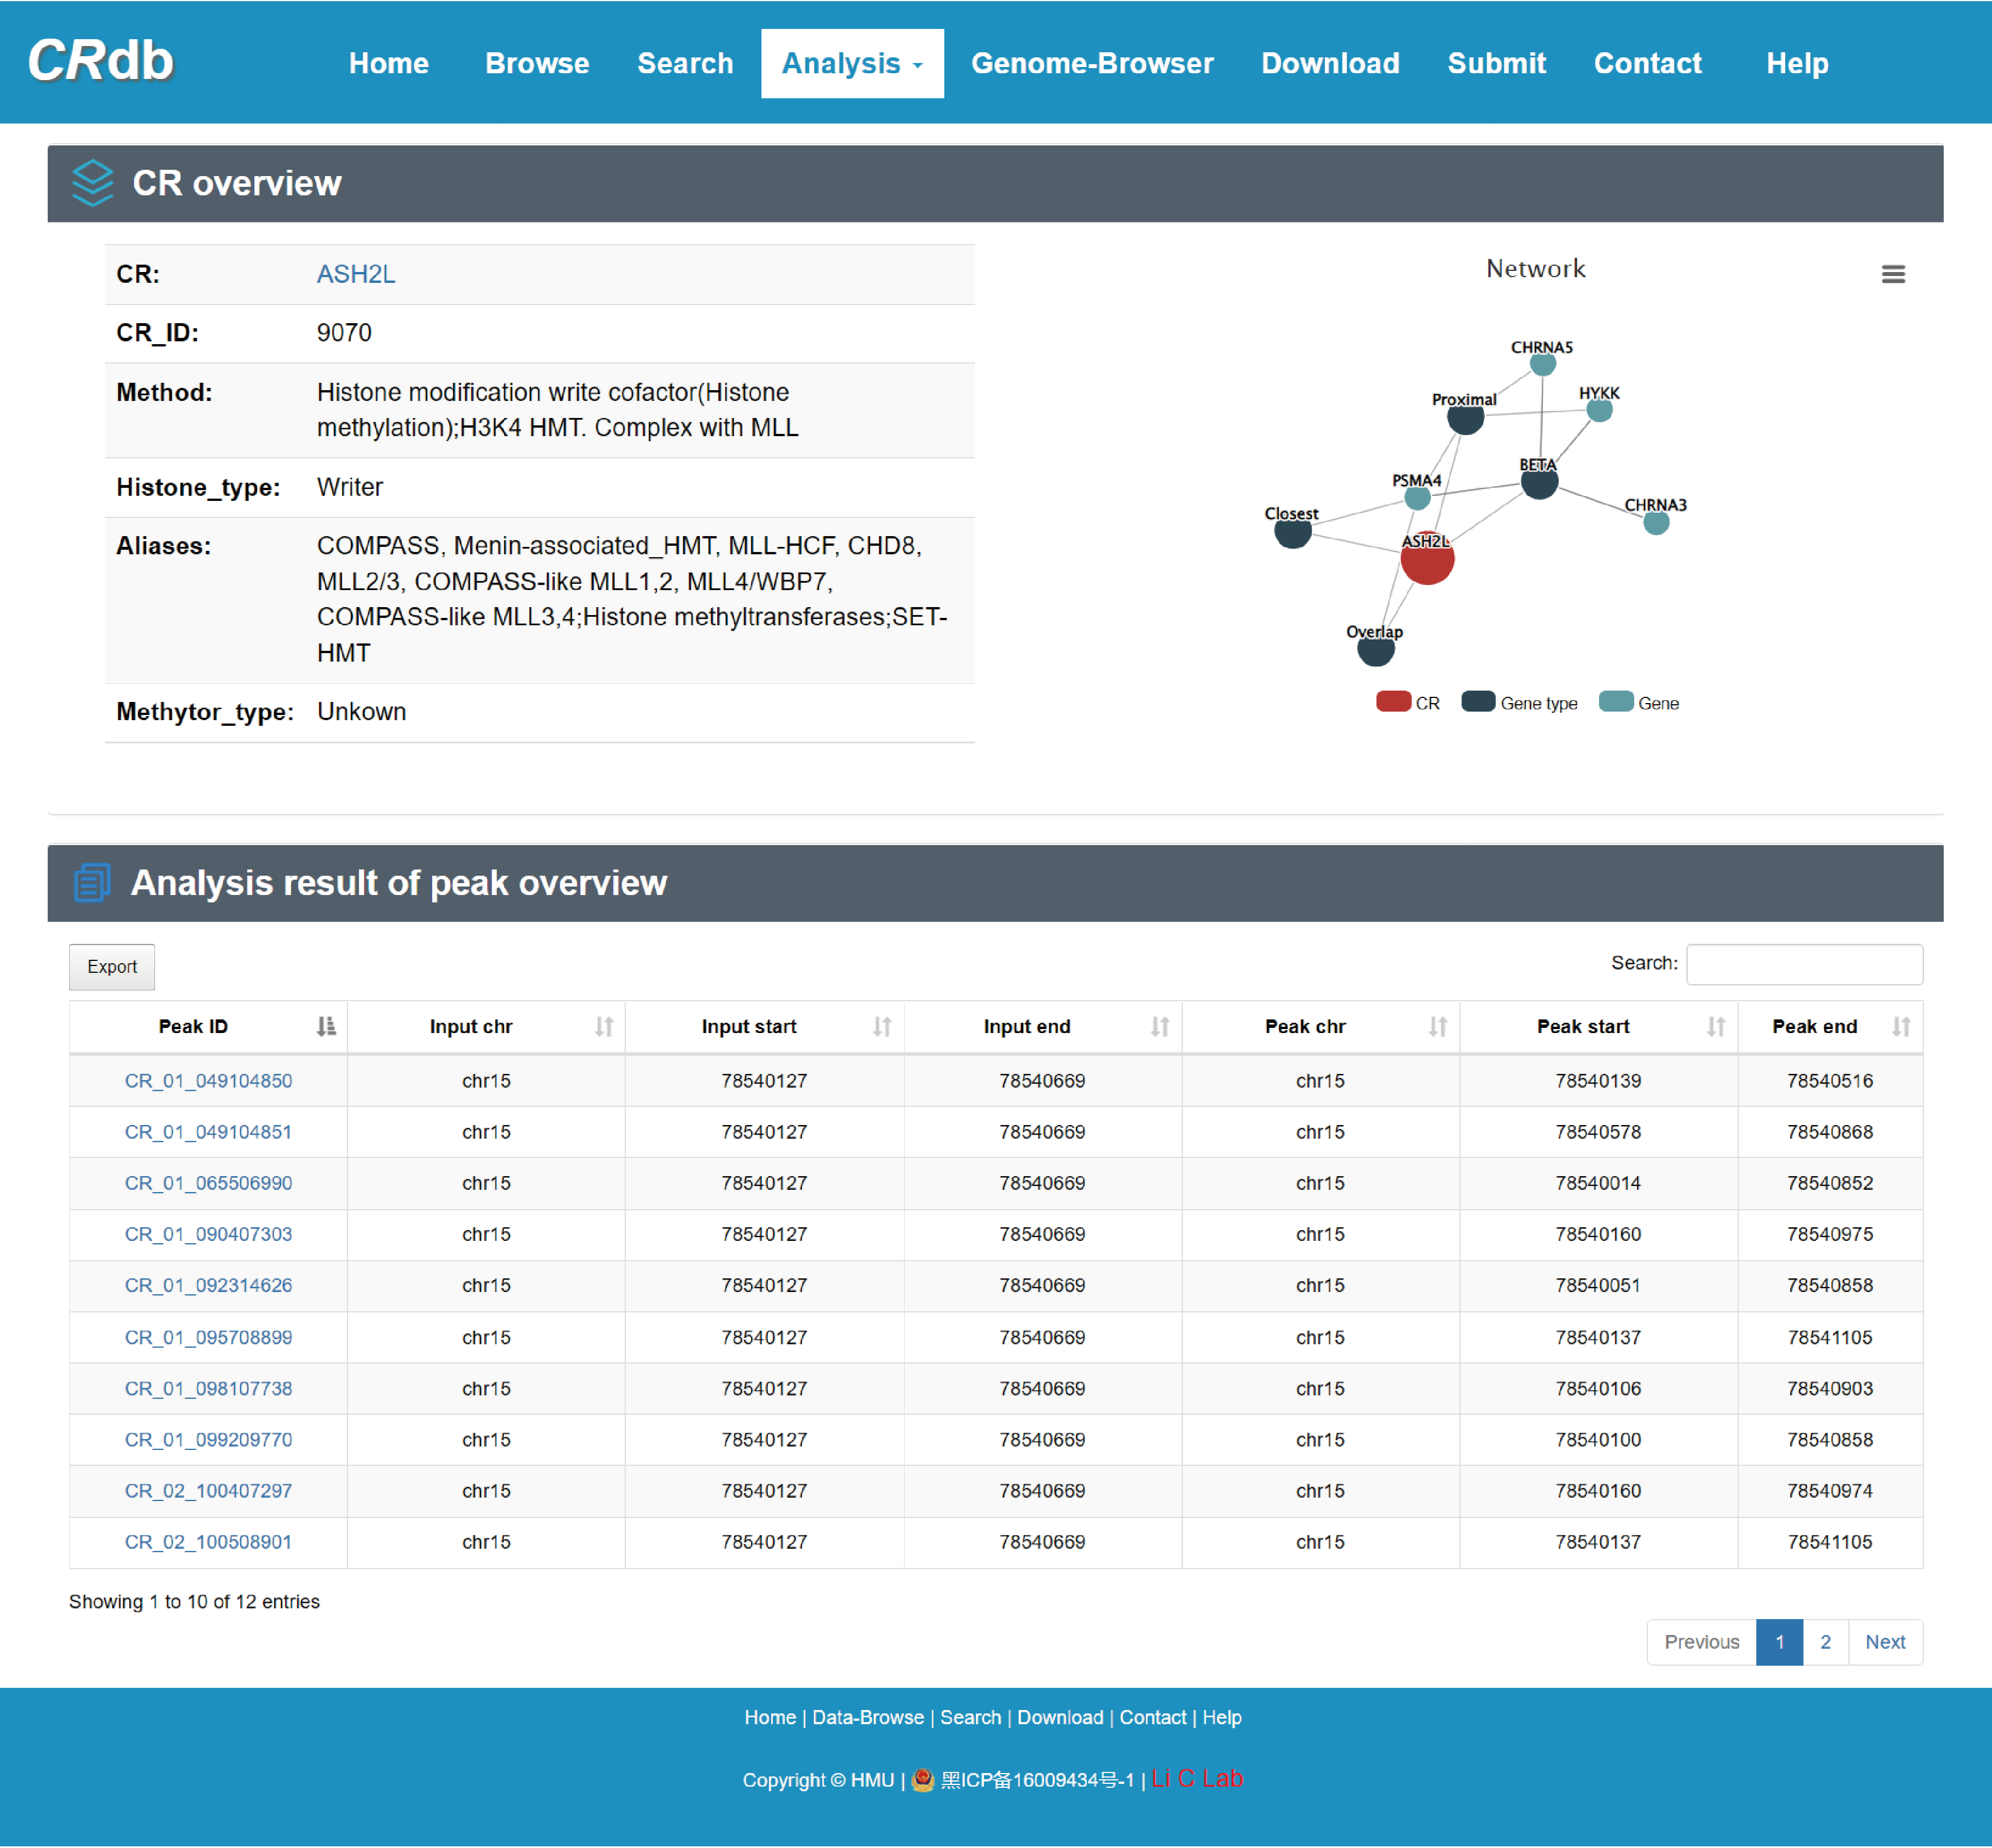
In this analysis, users input the genomic region of interest (in .bed format), while setting the minimum proportion value of the intersection of input genome region and CR binding region. CRdb will calculate the intersection between the input genome region and each CR binding region, returning information about all CRs that combine with input genomic regions with proportion greater than the minimum proportion value (including CR name, functional type, number of peaks, the region of input peaks and the number of overlap). Furthermore, users can obtain comprehensive annotation information of overlapping genomic regions by clicking on "details". The guidance for input format is as below:
Region definitions are ordinary 3-field bed file format.
#column 1: The name of the chromosome (e.g. chr3, chrY).
#column 2: The starting position in the chromosome.
#column 3: The ending position in the chromosome.
For example: Example of Upload File
chr15:78540127-78540669
chr2:27628897-27629209

Brief information on the search results is displayed in a table on the result page, The CR can be visualized by clicking the "CR" button.
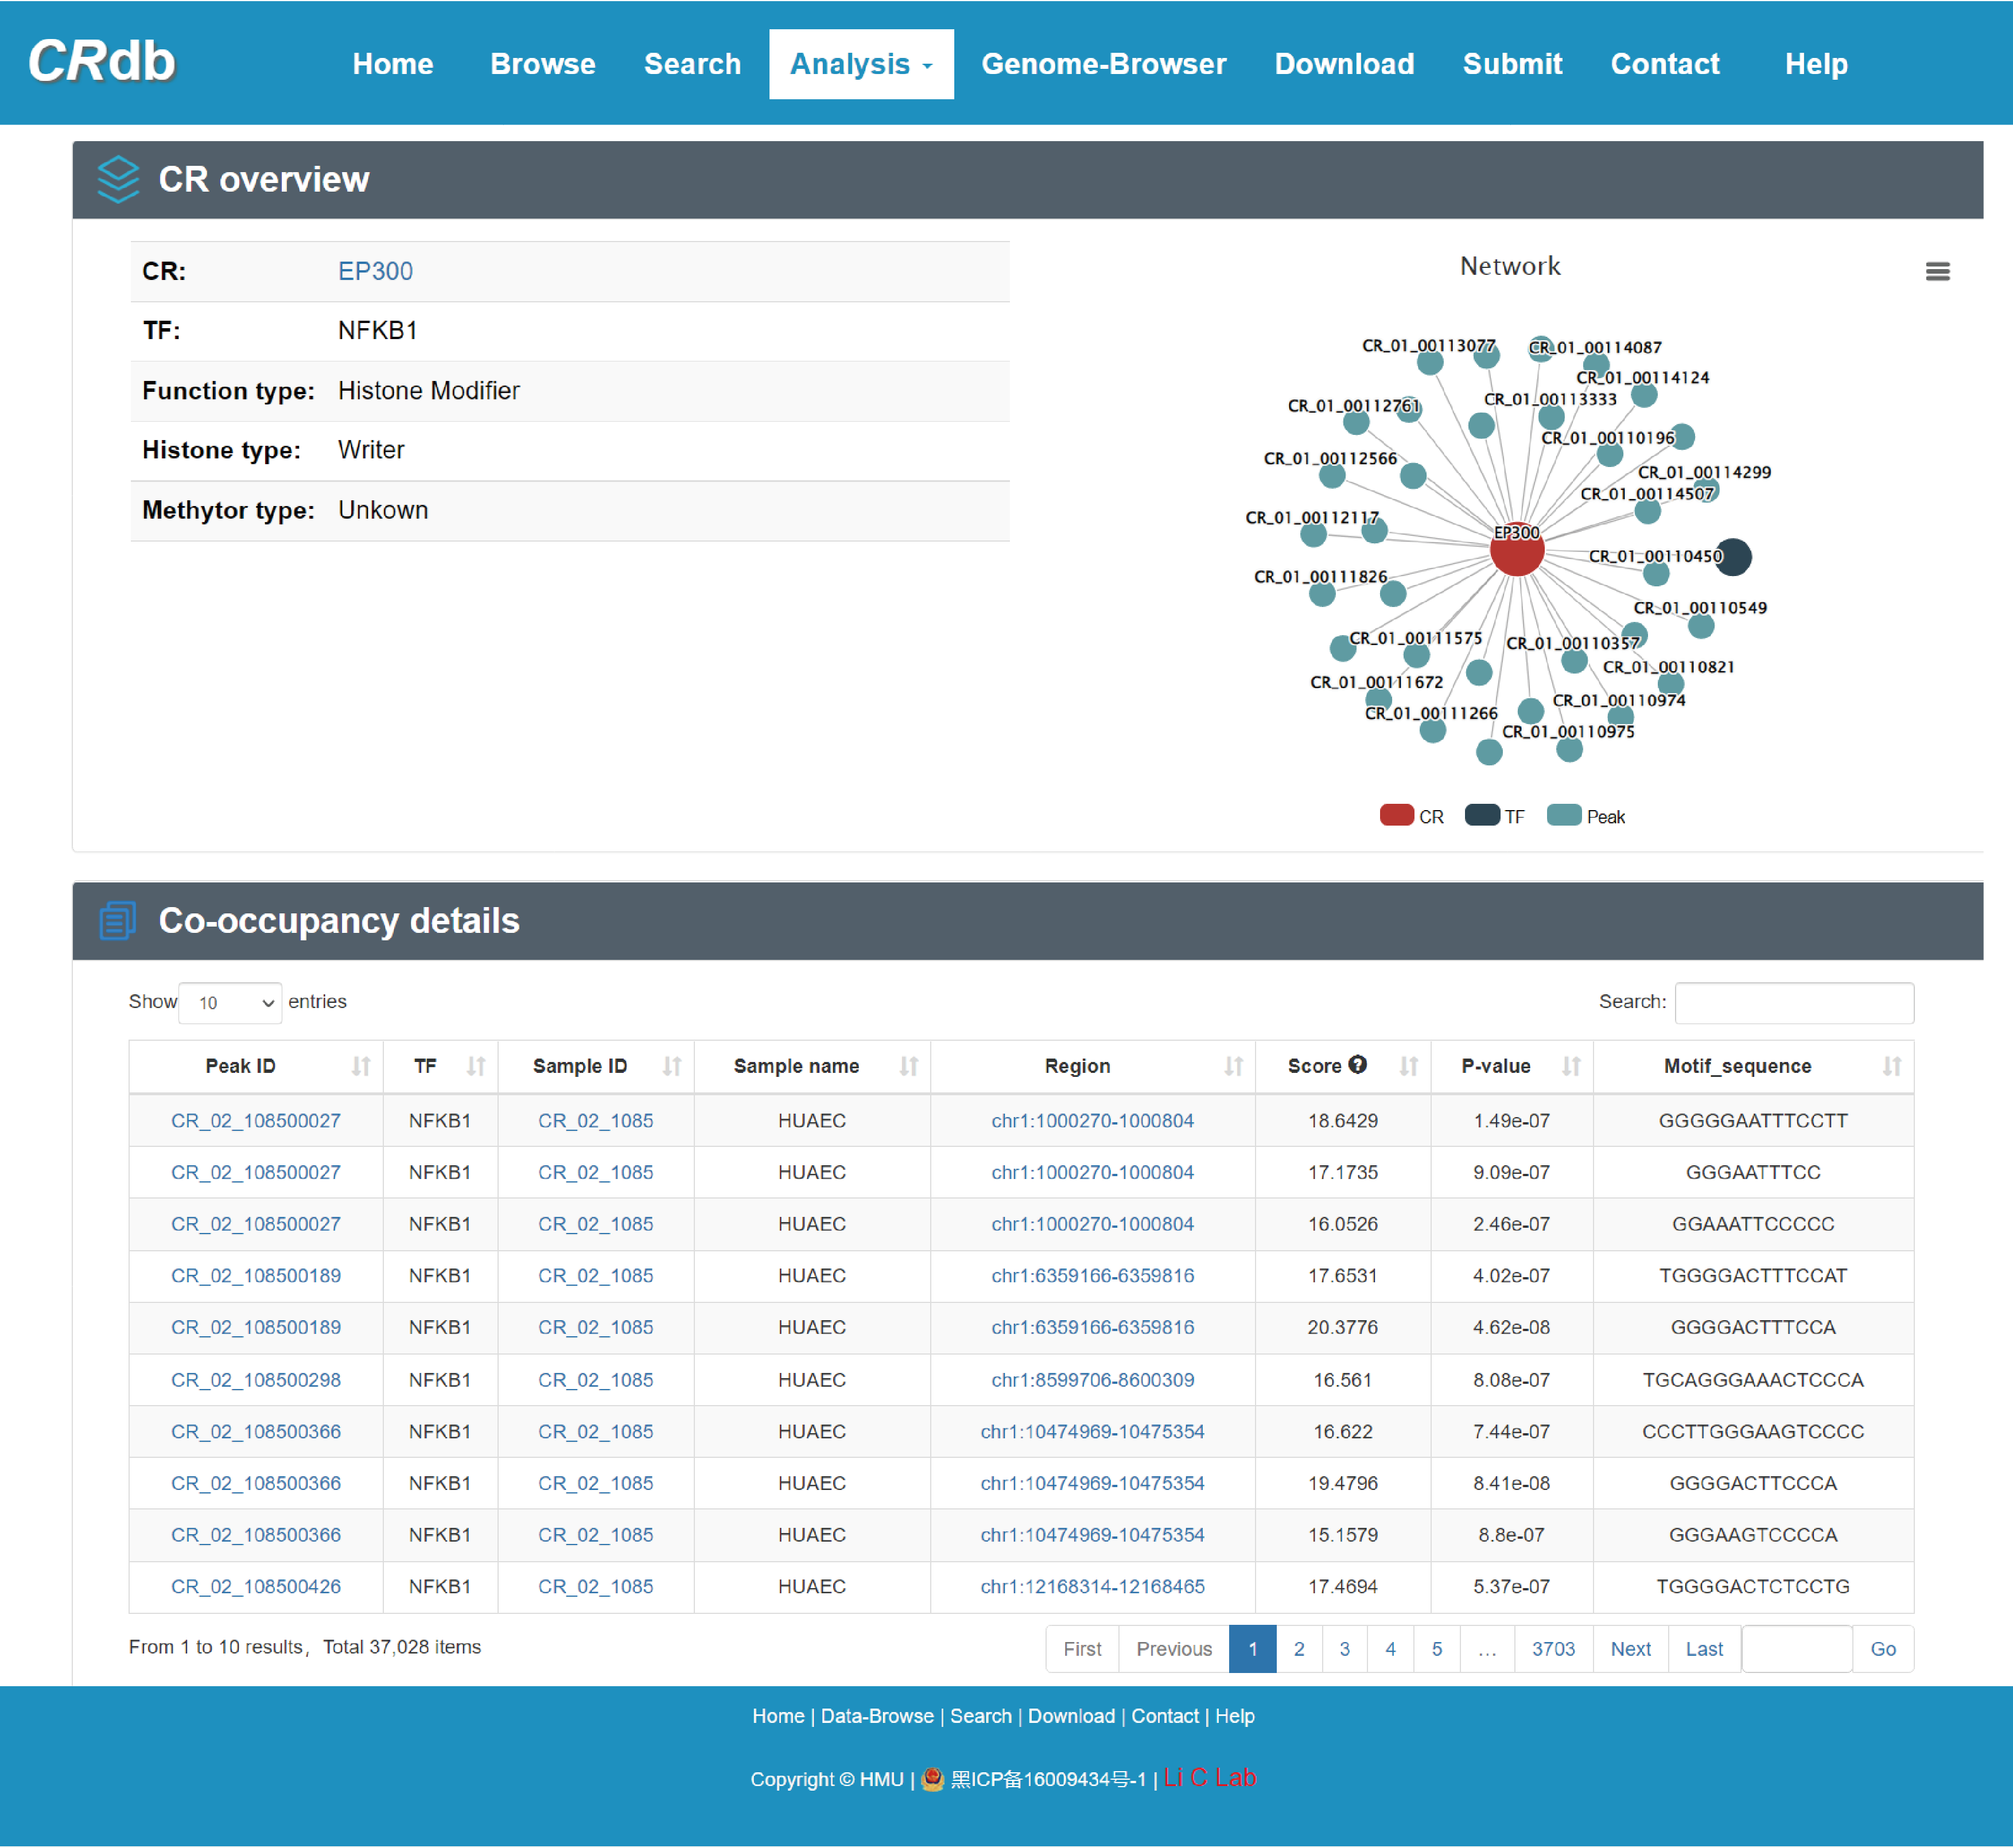
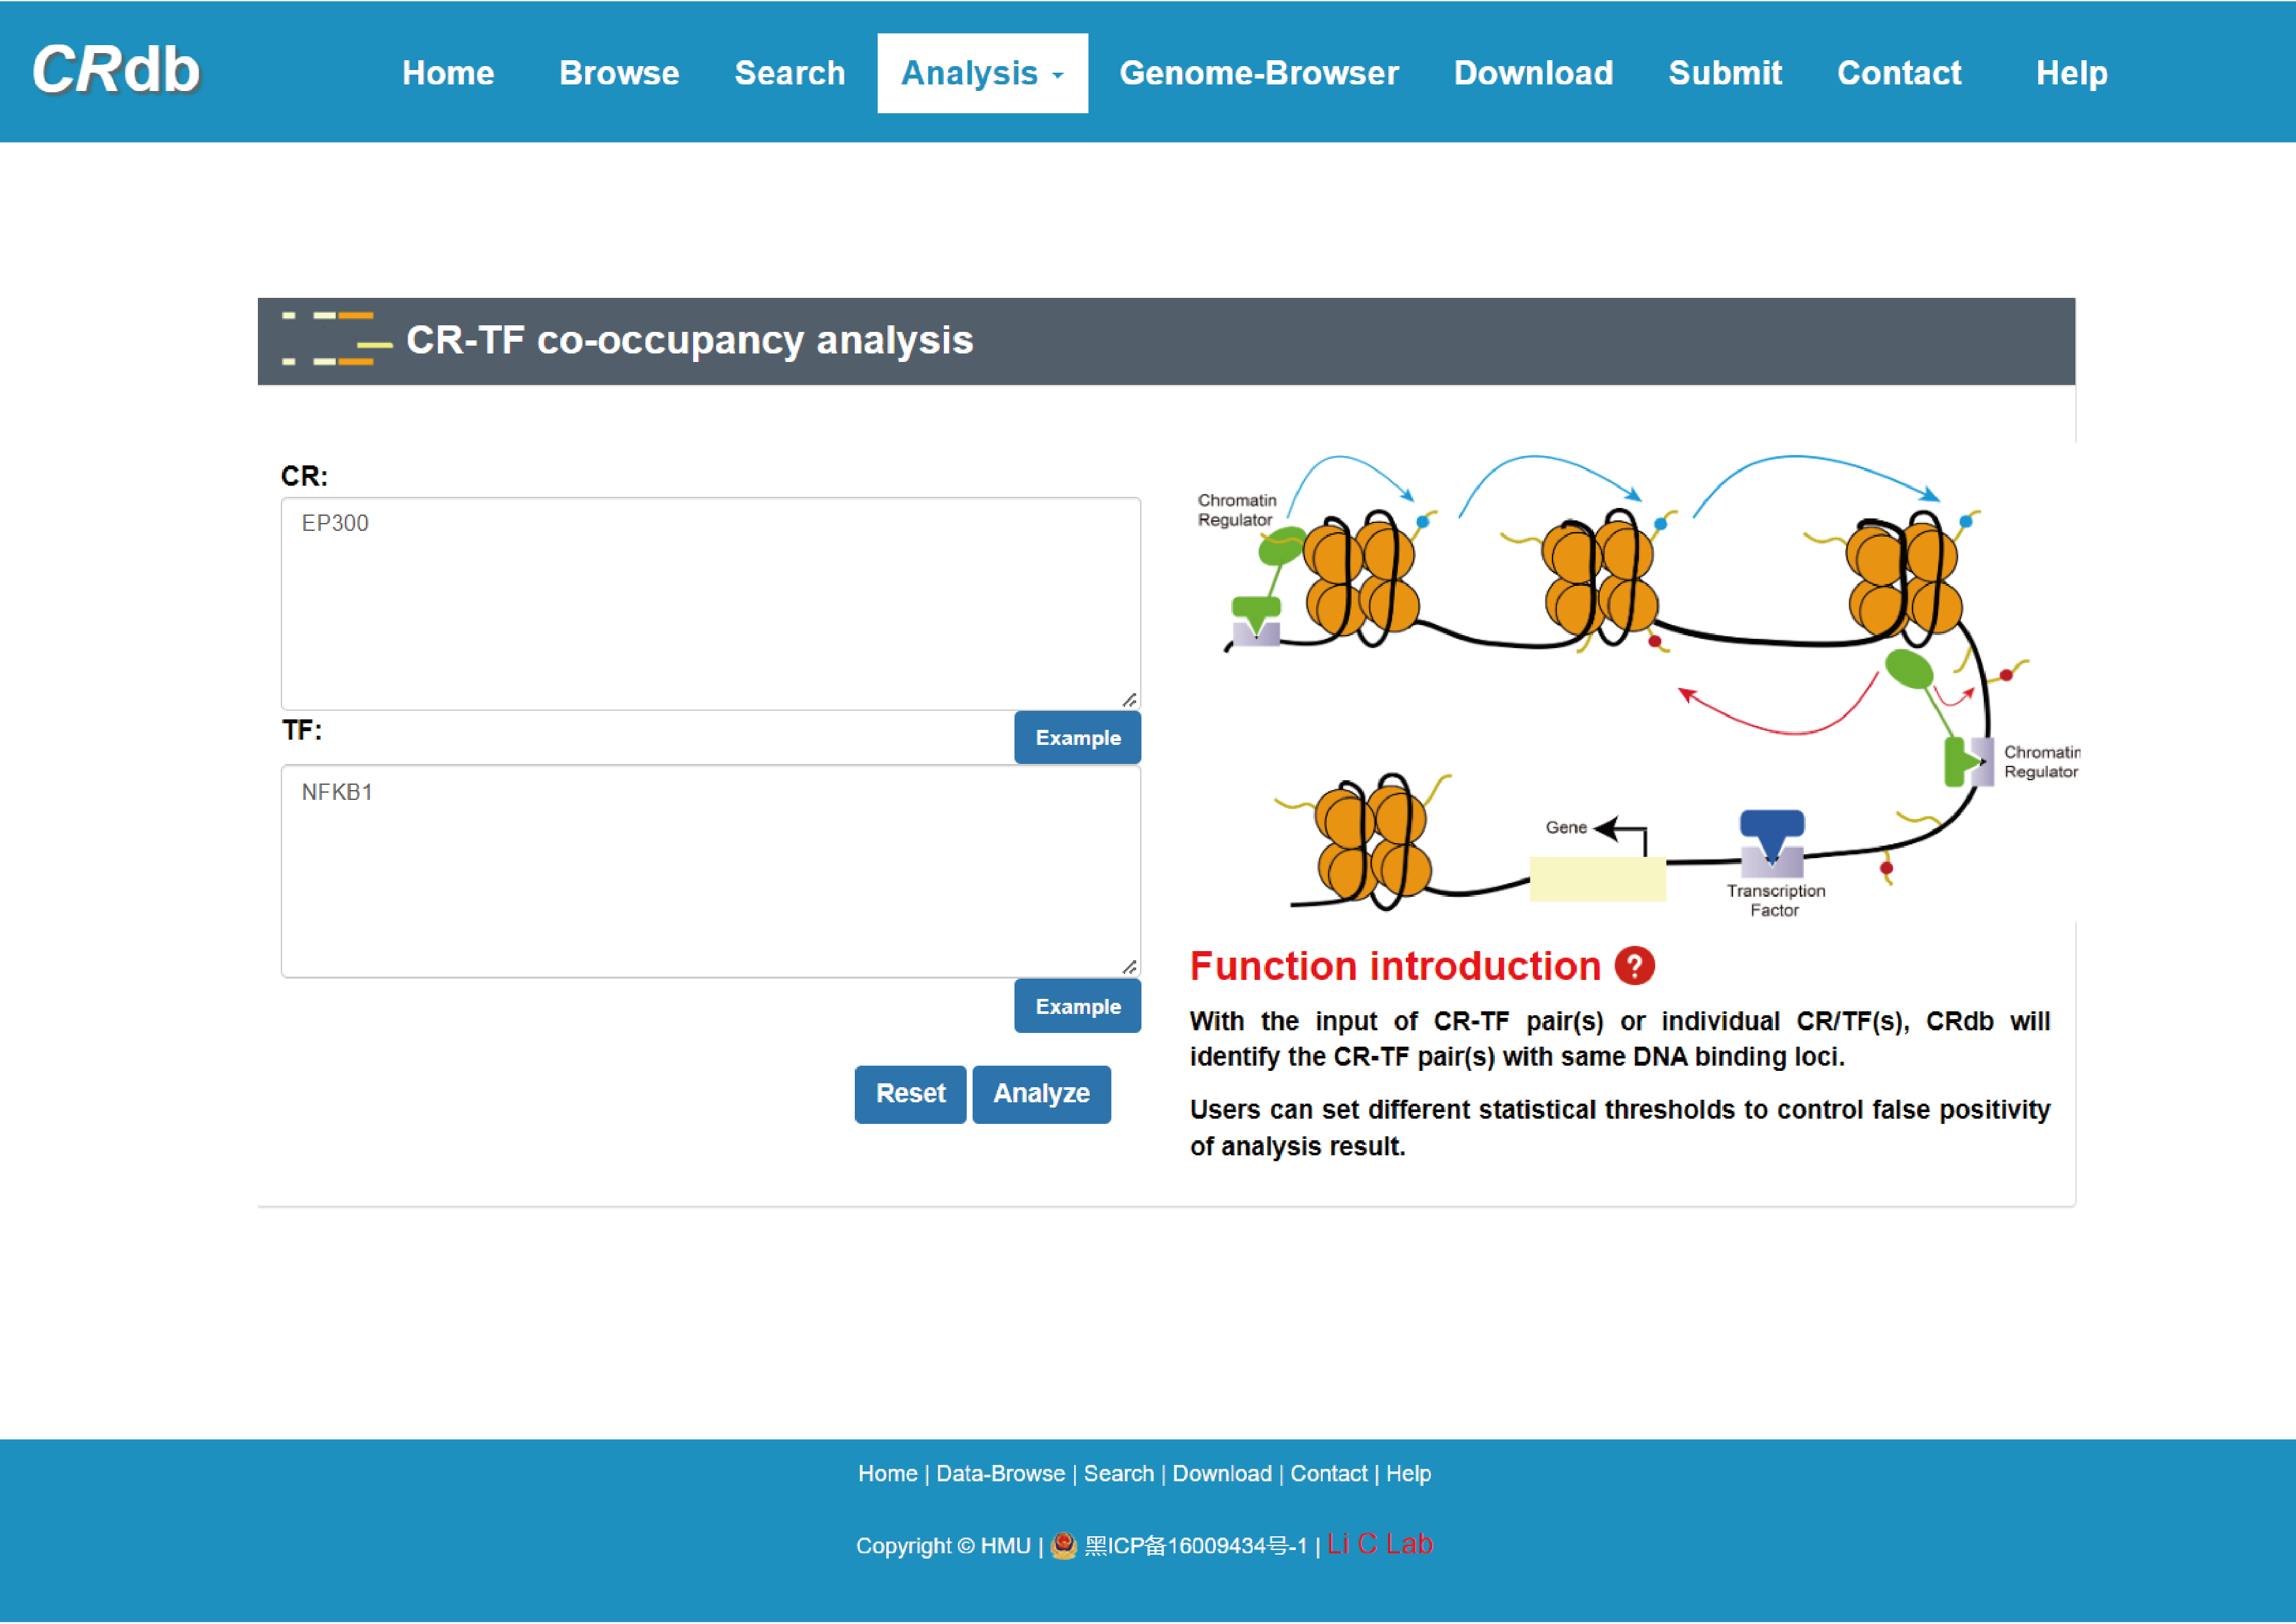
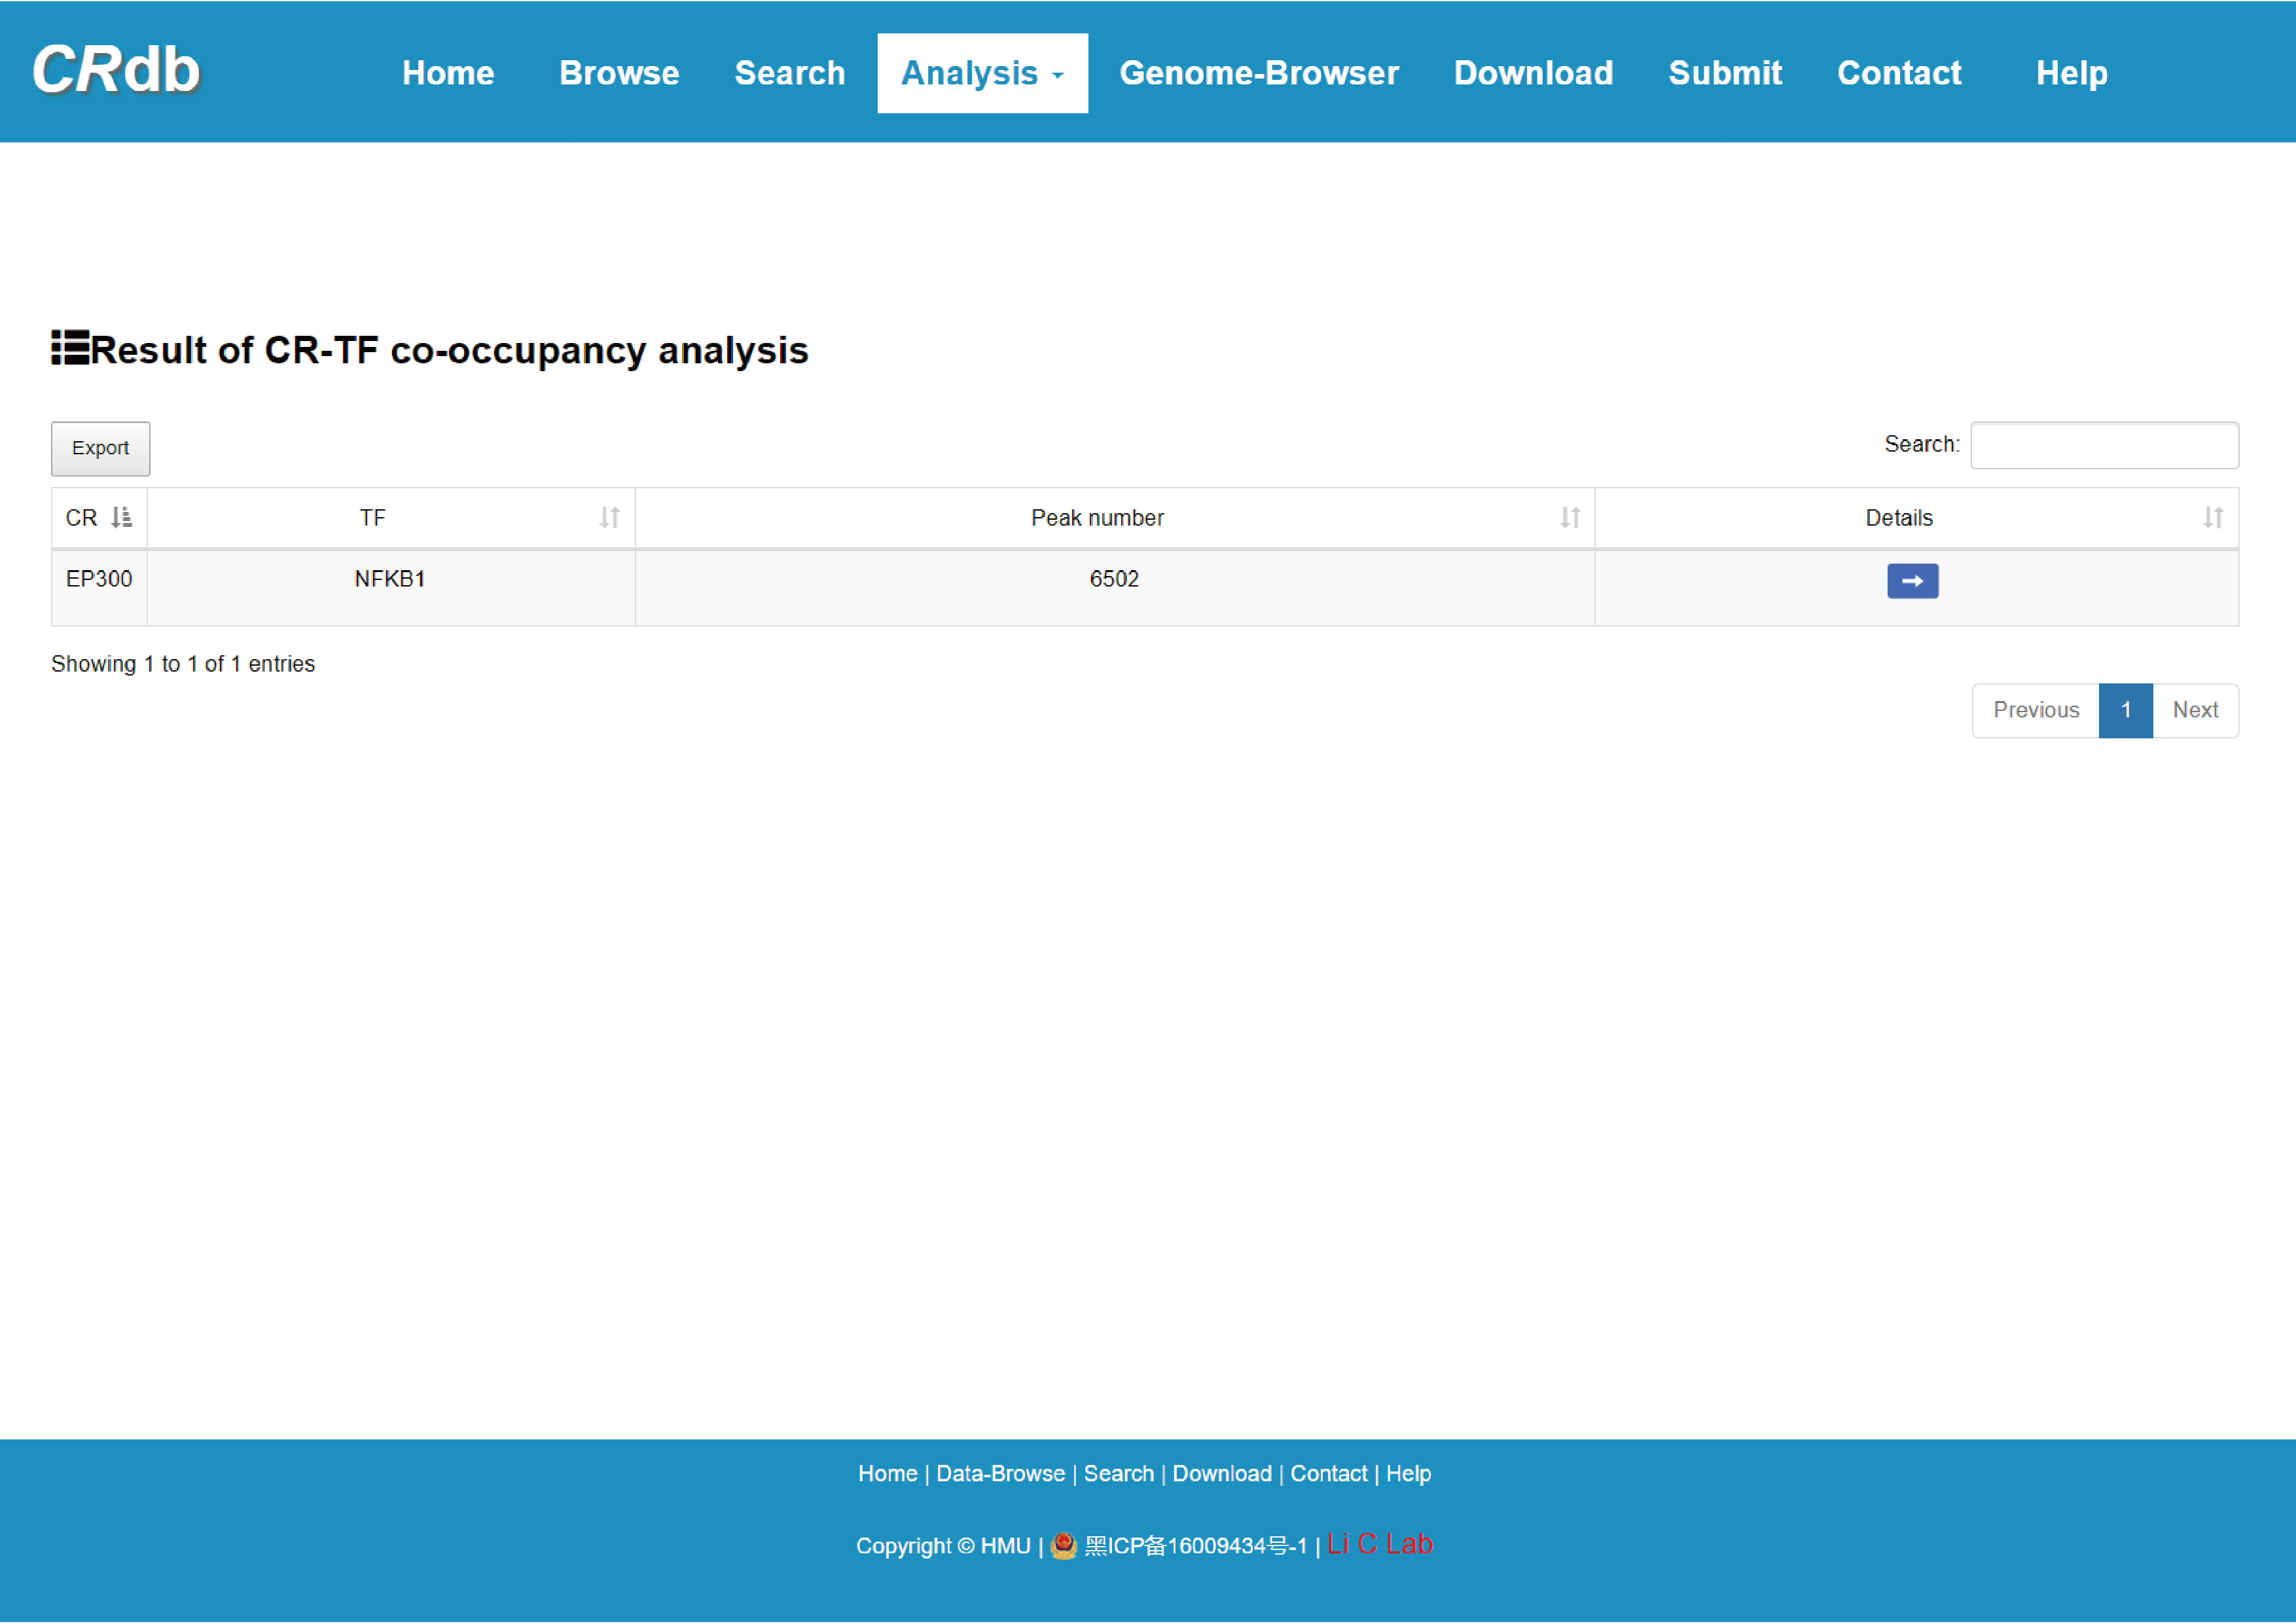
4.6.3 CR-TF co-occupancy analysis
Enter"CR-TF co-occupancy analysis"function page.
In the "CR-TF co-occupancy analysis", users can obtain the number of co-binding peaks for the CR-TF pairs by inputting multiple CRs and TFs or inputting CR(s)/TF(s). We defined the colocalization relationship between CRs and TFs by performing the intersection of CR binding region and binding regions of TFs. Users can find TFs that have a synergistic relationship with CRs of interest, and also CRs that cooperate with TFs inputted by themselves.
The FIMO software was used in this study to predict the binding location of the TF on the CR ChIP-seq peak.
Brief information of the search results is displayed in a table on the result page, the specific information can be viewed by clicking the "Details" button.
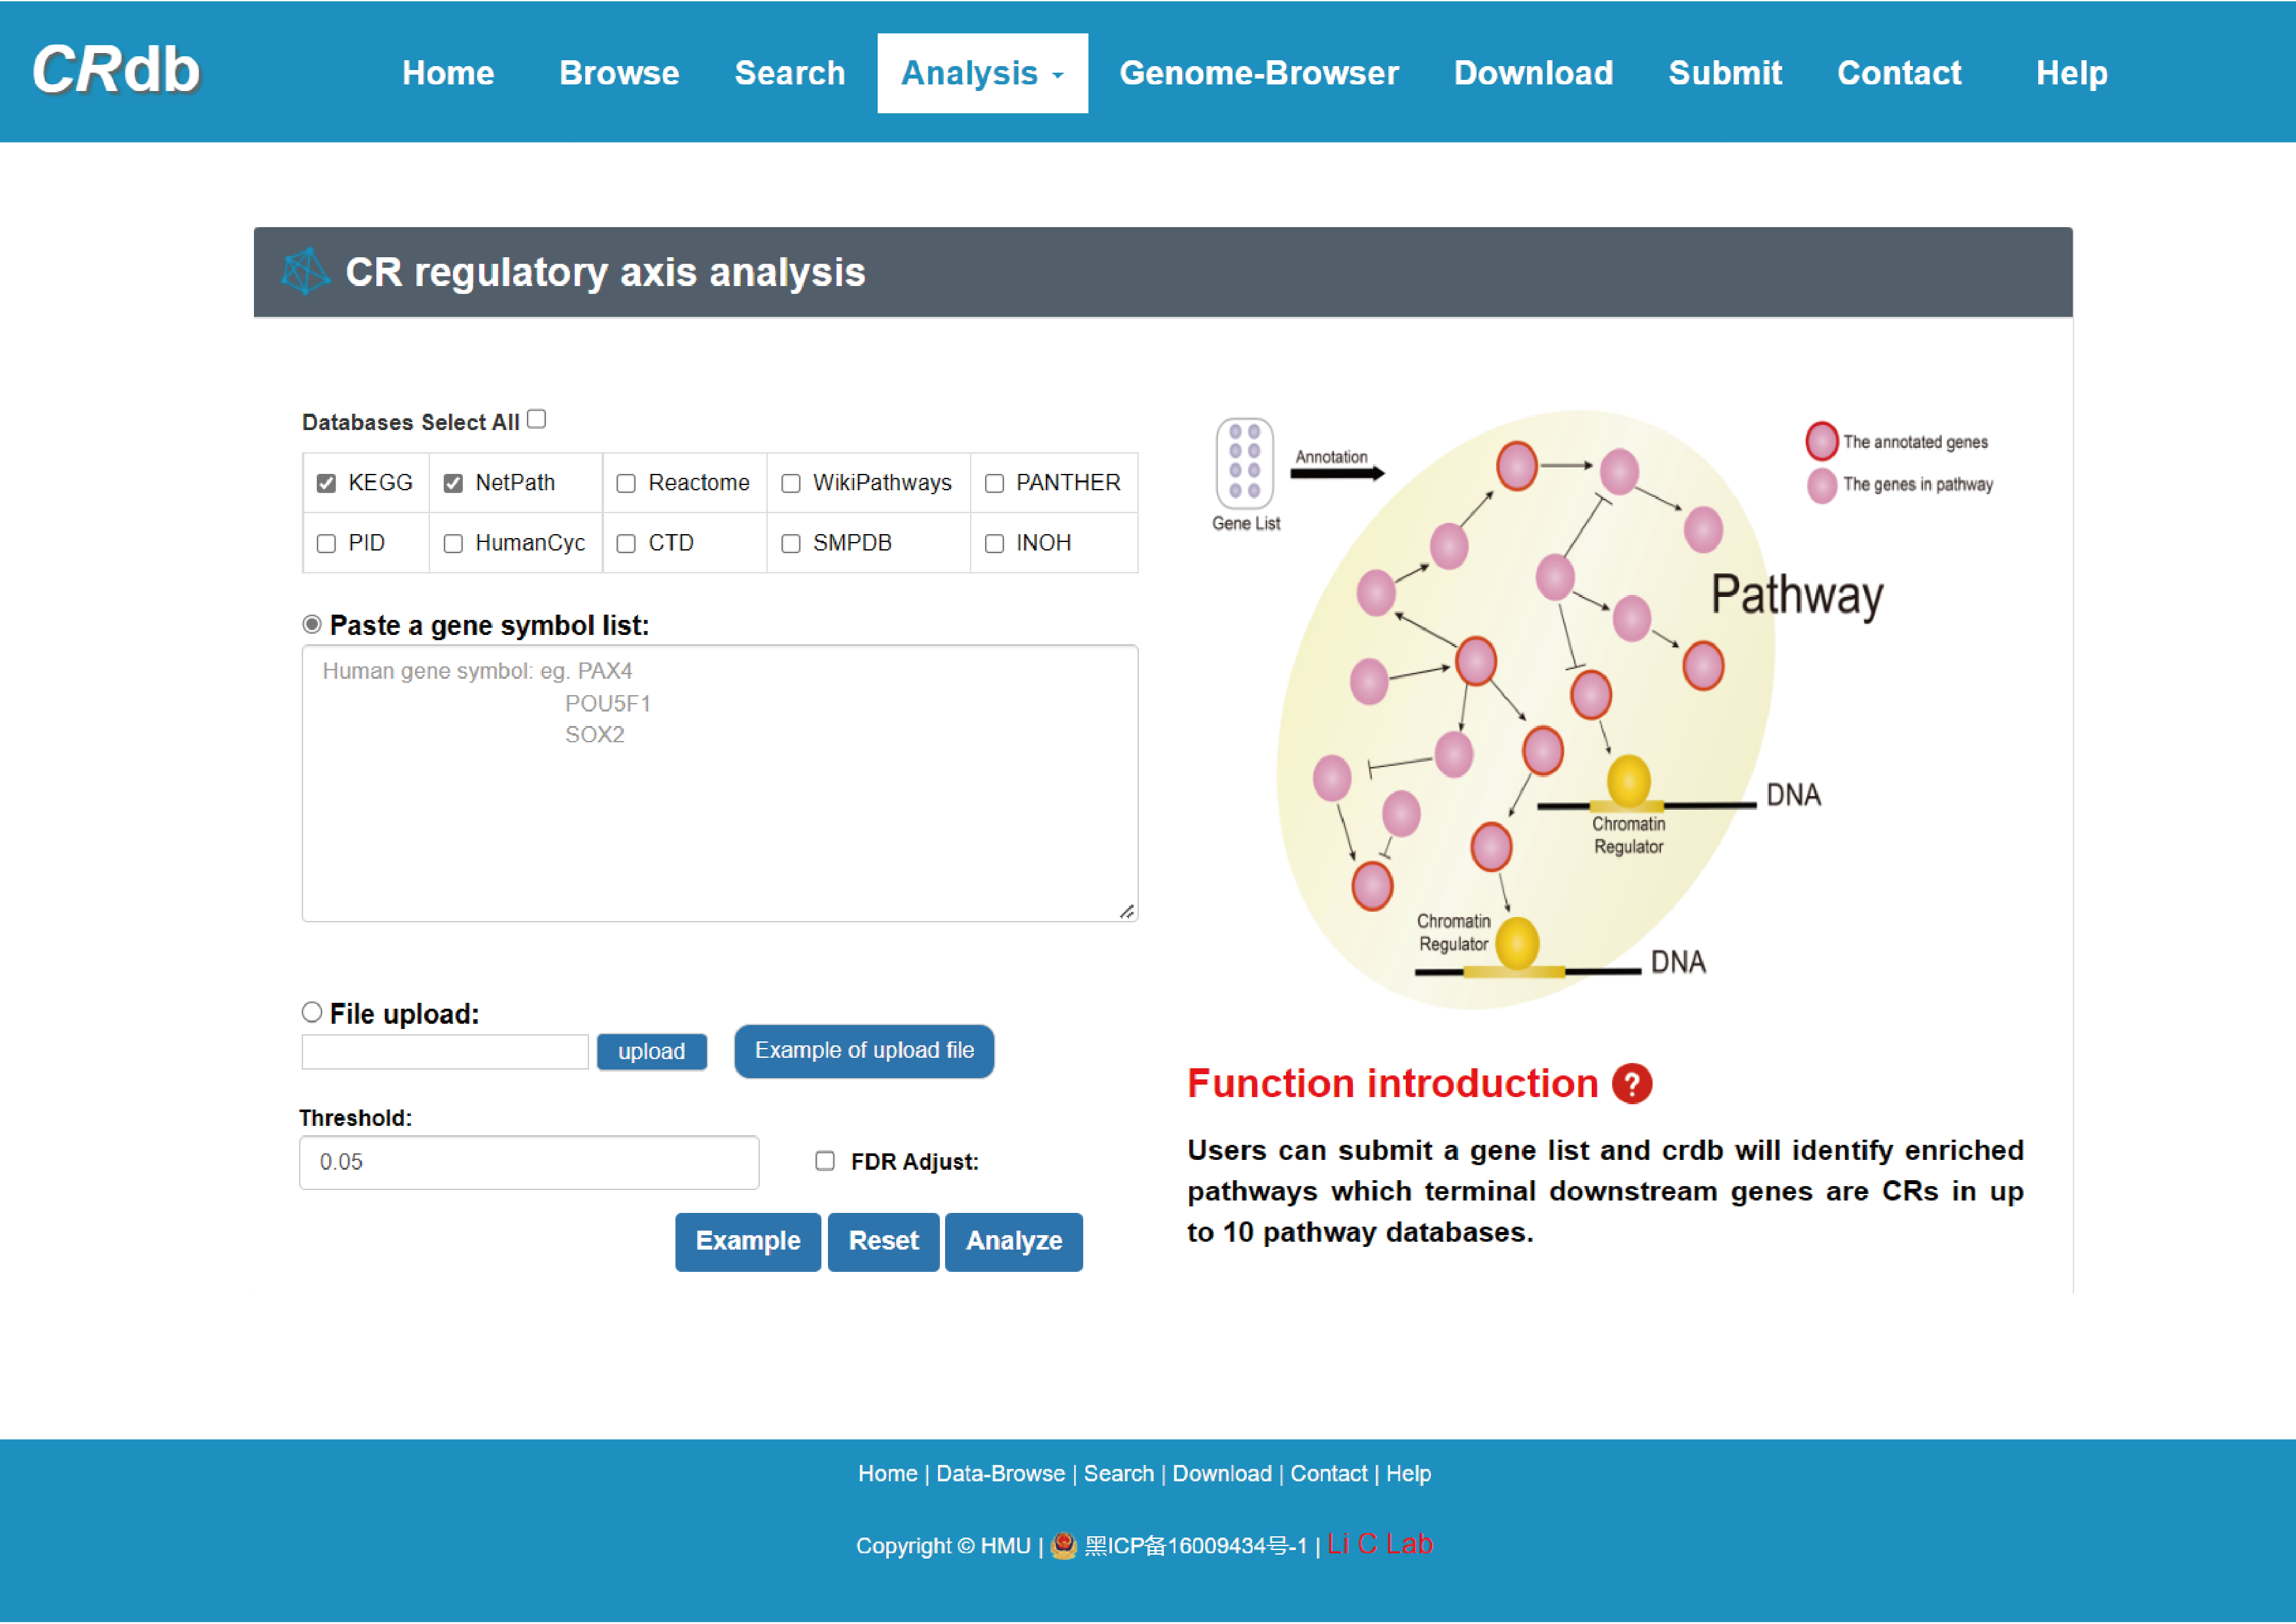
4.6.4 CR regulatory axis analysis
Enter"CR regulatory axis analysis"function page.
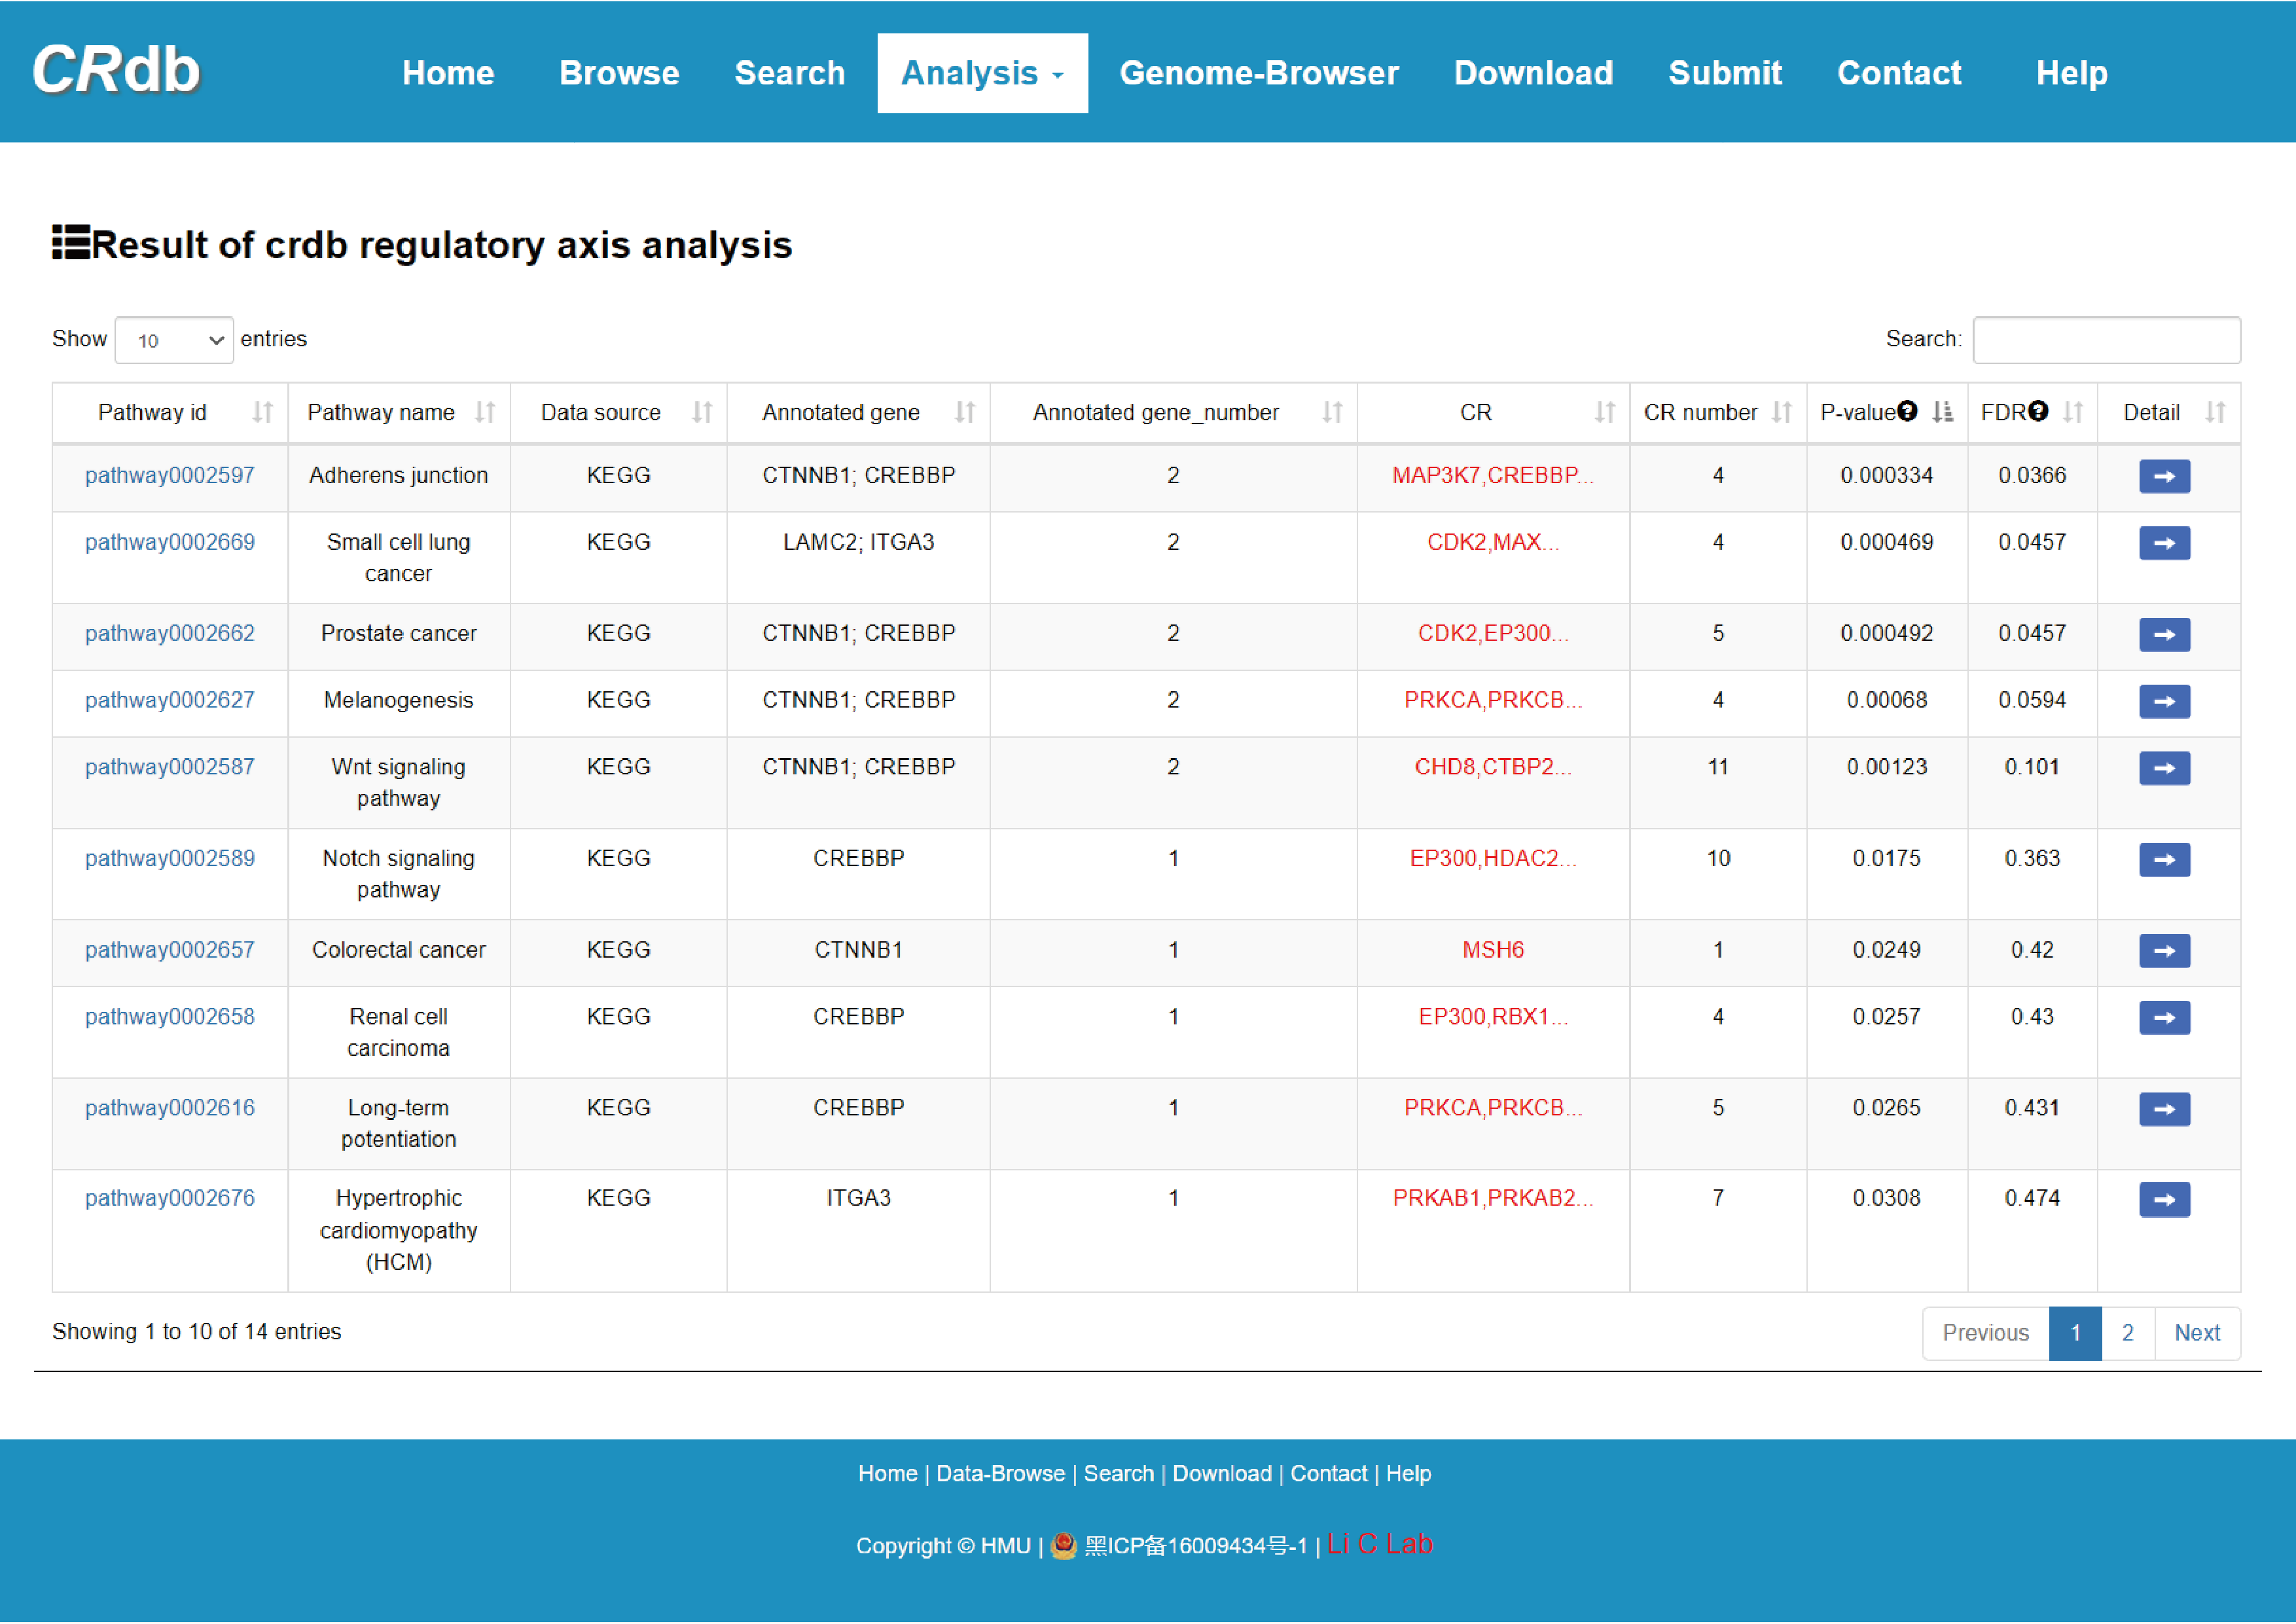
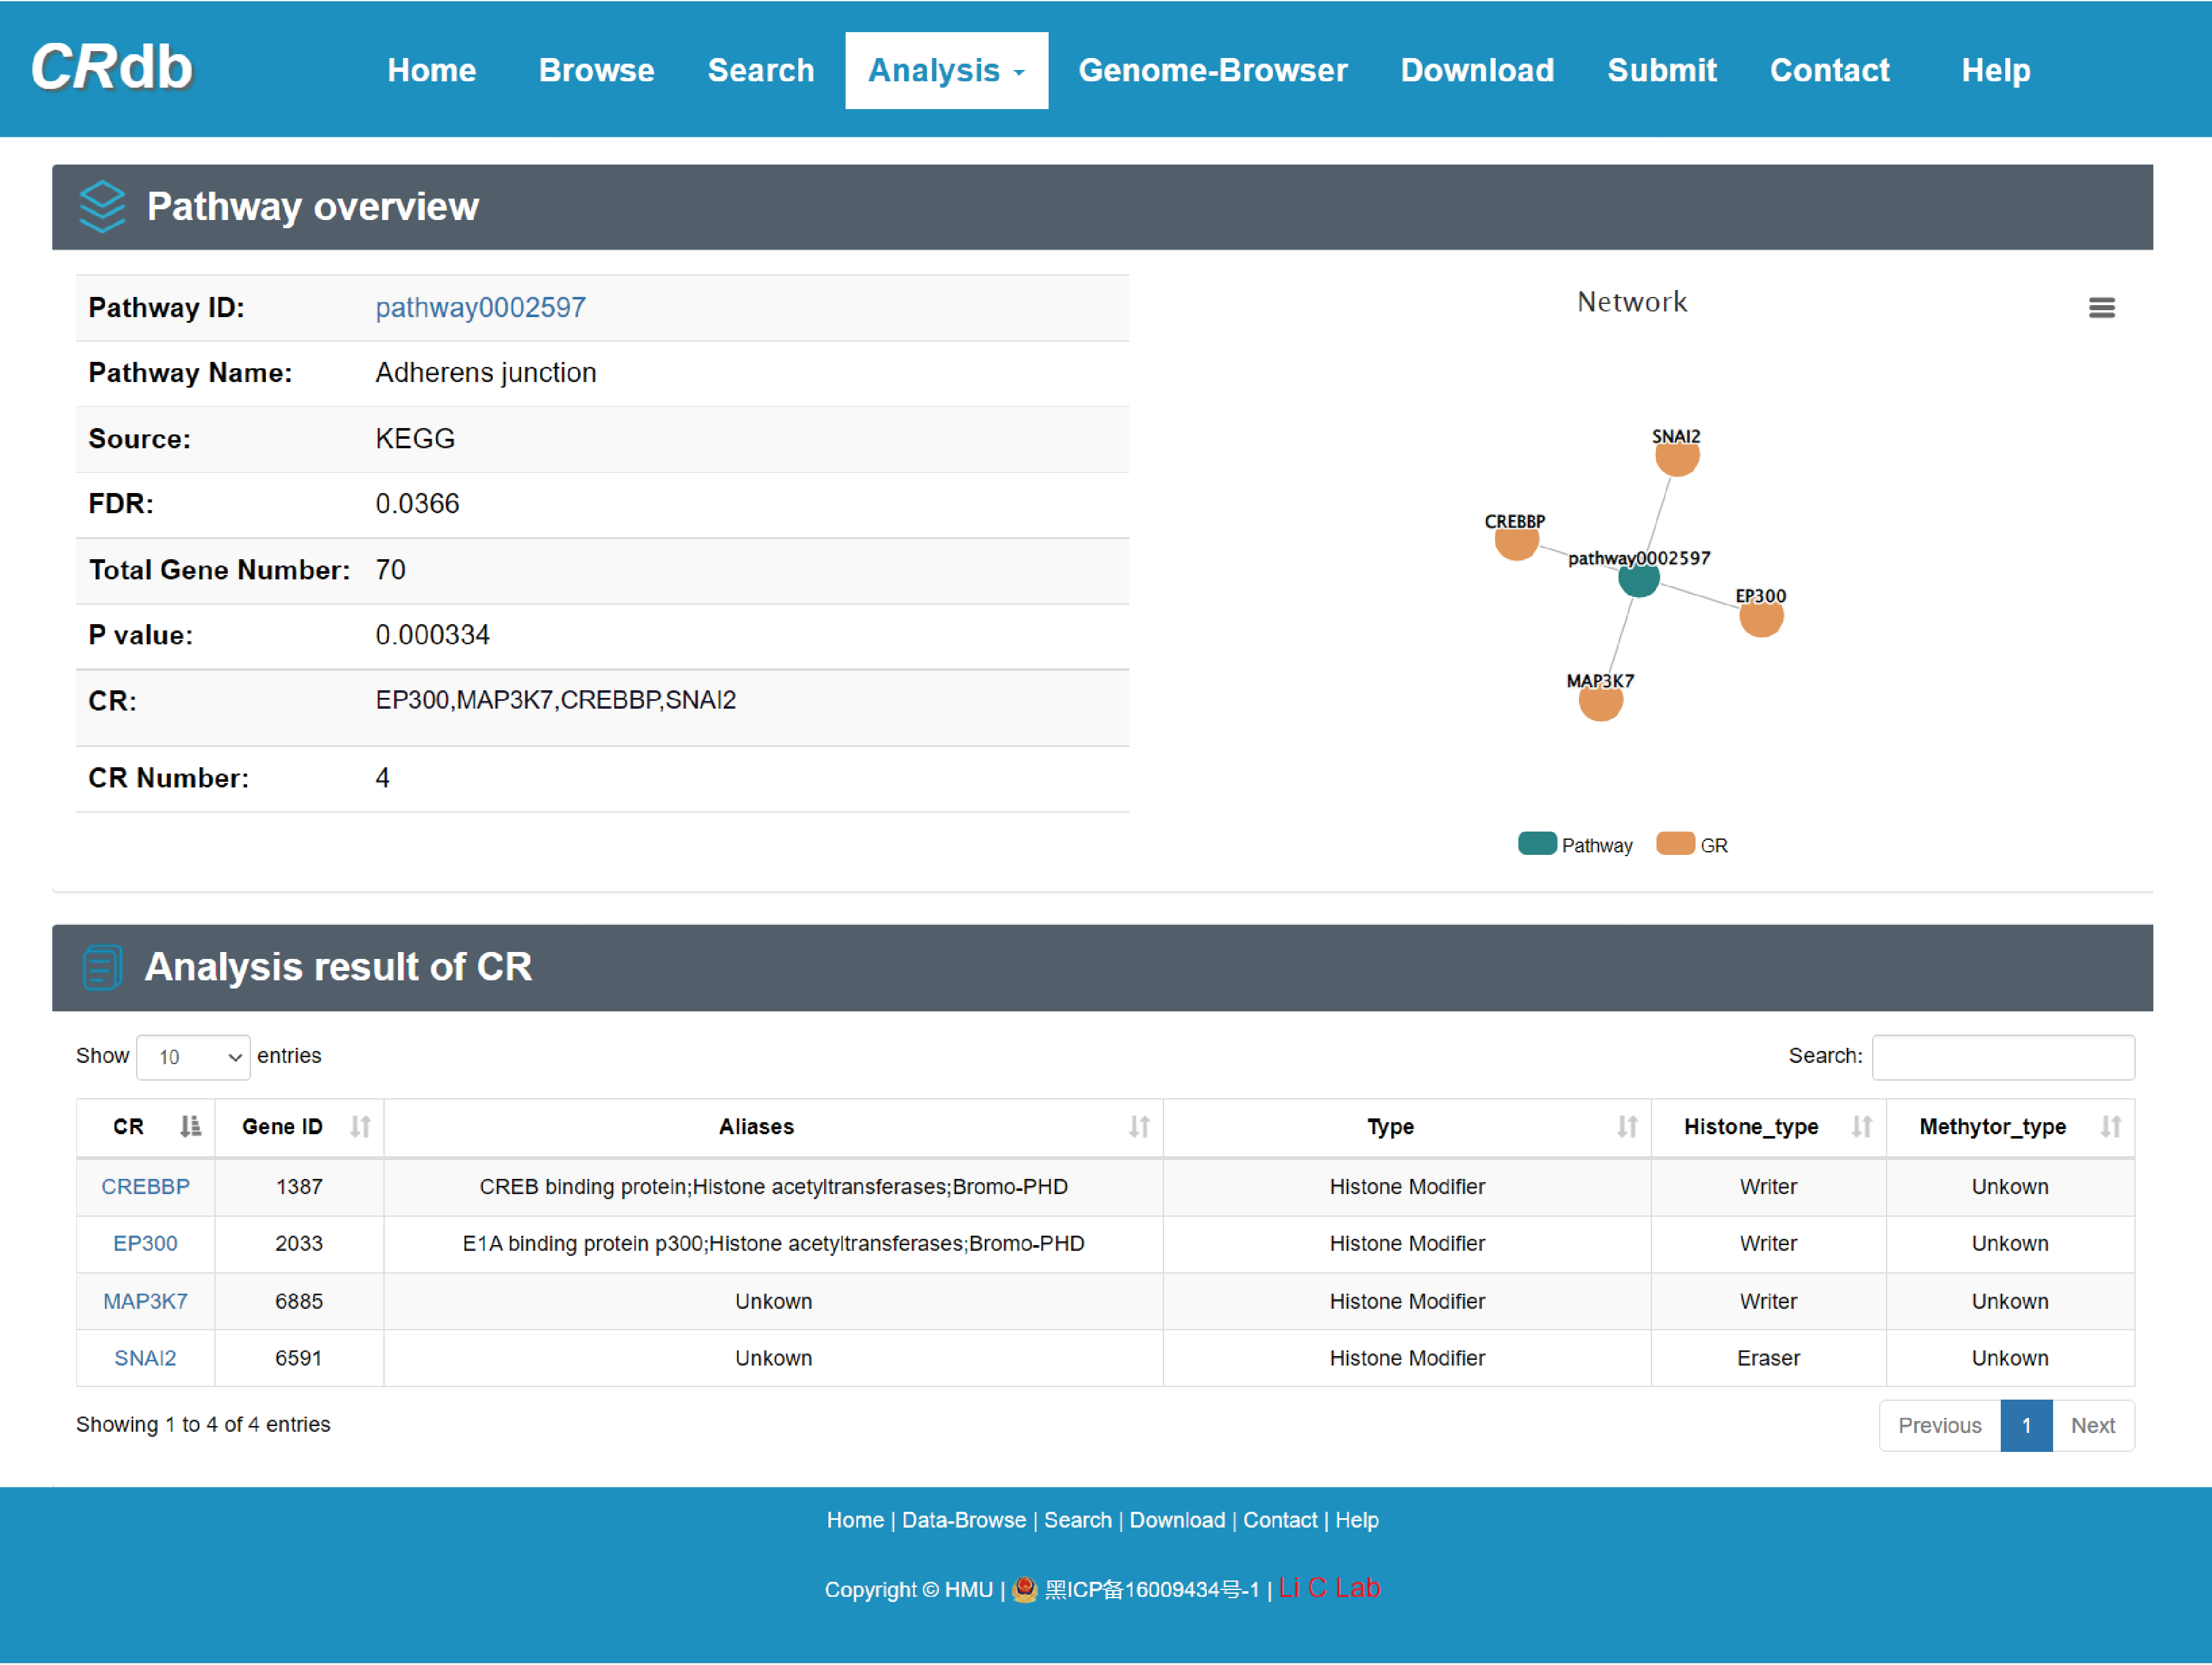
To find the CRs associated with pathways, CR regulatory axis analysis was performed. Users can submit a gene set of interest and select at least one pathway database (e. g. KEGG), while also selecting the P-value/FDR. First, CRdb identifies pathways significantly enriched for these genes using hypergeometric tests. Next, we will identify CRs on the downstream of pathway and provide regulatory information about these CRs. Pathway ID, pathway name, CR, CR number, number of enriched genes, and P-value are provided in the results page. Similarly, users can get more detailed pathway information by clicking on the "Details" button. In the course of this analysis, we may uncover new regulatory patterns of not yet mentioned genes, pathways, and CRs to obtain potential new targets.
With the input of gene(s) of interest or a ‘txt’ format file, CRdb will identify significantly enriched pathways whose terminal downstream genes are CRs.
The guidance for input format:only gene symbol is supported (case-insensitive).
The output table shows pathway basic information (Pathway ID, Pathway name, Pathway source, Annotated gene, Annotated gene number, Total gene number, The terminal CR and CR number), enrichment score p-value and FDR. The pathways can be visualized by clicking the "pathway ID" button. The output table also provides a “Detail” page to further show the information of CRs. The regulatory networks based on the CRs in this pathway can also be visualized. The CR can be visualized by clicking the "CR" button.
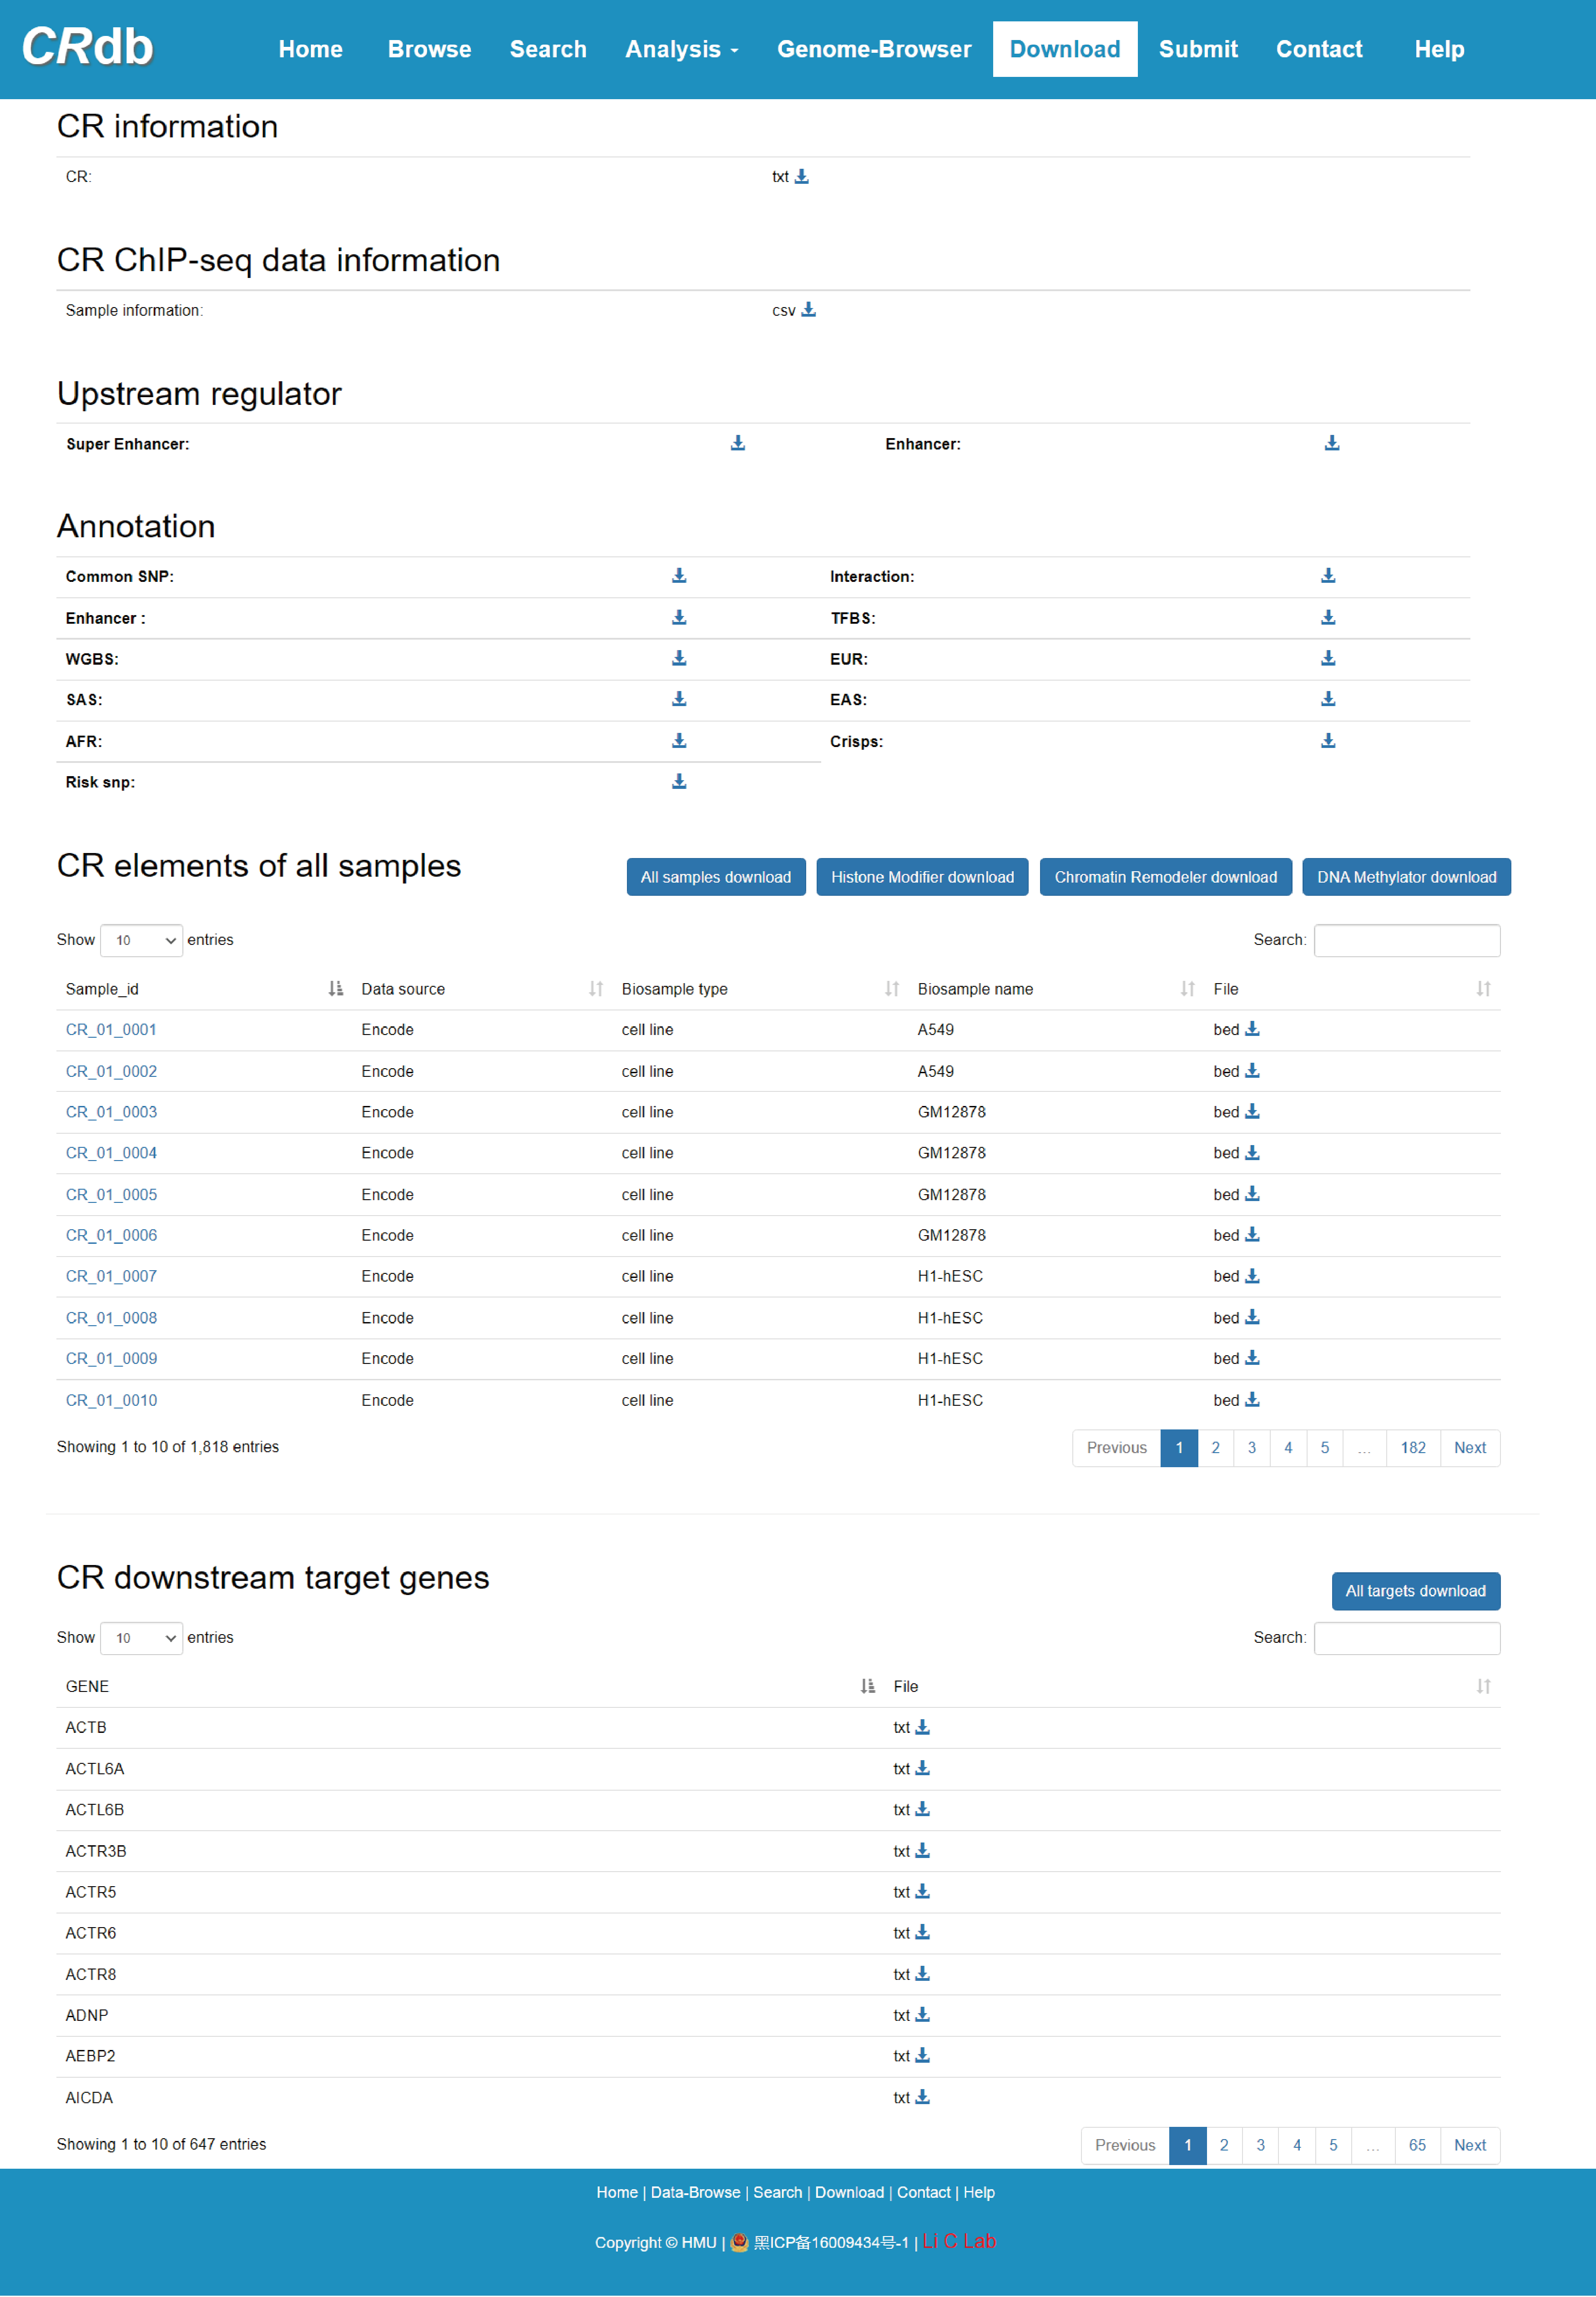
URL: http://crdb.liclab.net/crdb/download.php
The “Download” page exhibits “CR information”, “CR ChIP-seq data information”, “CR elements of all samples”, “CR downstream target genes”. We support “.bed” or “.txt” formats for data download.
URL: http://cr.liclab.net/crdb/submit.php
The “Submit” page provides a strategy for sharing CR-related ChIP-seq data for CRdb update. CRdb recommends that users submit the corresponding GEO/SRA series number or the corresponding accessible URL for the raw data to ensure the data quality control. Moreover, the submitter is required to fill in the relevant information for the submitted data, as well as the user's e-mail.

The current version of CRdb was developed using MySQL 5.7.17 (http://www.mysql.com) and runs on a Linux-based Apache Web server (http://www.apache.org). PHP 7.0 (http://www.php.net) was used for server-side scripting. The interactive interface was designed and built using Bootstrap v3.3.7 (https://v3.bootcss.com) and JQuery v2.1.1 (http://jquery. com). ECharts (https://www.echartsjs.com/) and Highcharts (https://www.highcharts.com.cn/) were used as a graphical visualization framework. We recommend to use a modern web browser that supports the HTML5 standard, such as Firefox, Google Chrome, Safari, Opera or IE 9.0+ for the best display.
The CRdb database is freely available to the research community using the web link (http://cr.liclab.net/crdb/index.html). Users are not required to register or login to access features in the database.
8.1 Identification of CR-associated genes
a) BETA is a software package based on the distance of binding sites and transcription start sites, and it can directly infer downstream target genes by integrating CR-associated ChIP-seq data. Genes within 100 kb of CR-binding region were considered as downstream target genes by BETA.
b) Genemapper is a python script of ROSE. ROSE can identify downstream target genes by calculating the proximity of CR-binding regions to genes, yielding the proximal genes, overlap genes and closet genes. “Proximal genes” refer to genes within 50 kb from the CR-binding region, “Overlap genes” refer to genes overlapping with the CR binding site region on the chromosome, and “Closet genes” refer to genes closest to the CR-binding region.
c) GEINE3 is a reverse-engineering-based approach that extracts gene regulatory networks from a large amount of expression data. GEINE3 selects the tree-based integrated learning algorithm among different model selection methods, which does not make any assumptions about the nature of gene regulation, and integrates and processes between regulation and nonlinearity.
d) ARACNe uses an information-theoretic framework and is a dependency measure based on reverse-engineering mutual information. The simplest model based on this approach is the "association network", which can compute mutual information between all pairs of genes and directly infer regulatory relationships between transcriptional regulatory proteins and target genes when the mutual information is greater than a given threshold.
e) TRRUST (v2) has manually proofreading the regulator-target gene relationships collected from more than 20 million life science and biomedical literature based on the text mining algorithm.
8.2 The quality control report of ChIP-seq sample
a) Mapping, Filtering and Duplication rate.
This section presents the mapping quality, duplication rate and distribution of reads in known genomic features.
b) ChIP Signal Distribution and Structure
In this section, the metrics relating to genome-wide depths of coverage and, the relationship between Watson and Crick reads are presented. The metrics are the SSD metric and cross-coverage metrics, Relative_CC and fragmentLength_CC.
c) Peak Profile and ChIP Enrichment
Following the identification of genome-wide enrichment (peak calling), the percentage of ChIP signal within enriched regions, as well the average profile across these regions can be used to further evaluate the ChIP-seq sample quality.